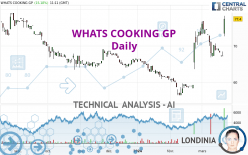
WHATS COOKING GP - Daily - Technical analysis published on 03/25/2024 (GMT)
- Who voted?
- 73
- 0
Click here for a new analysis!
- Timeframe : Daily
- - Analysis generated on
- Status : TARGET REACHED

Summary of the analysis

Additional analysis
Quotes
The WHATS COOKING GP rating is 77.4 EUR. The price registered an increase of +15.18% on the session with the lowest point at 72.6 EUR and the highest point at 78.2 EUR. The deviation from the price is +6.61% for the low point and -1.02% for the high point.A bullish gap was detected at the opening by the Central Gaps scanner. There are a lot of buyers and they have the upper hand in the very short term.
Opening Gap UP
Type : Bullish
Timeframe : Openning
A study of price movements over other periods shows the following variations:
New HIGH record (1st january)
Type : Bullish
Timeframe : Weekly
New HIGH record (1 month)
Type : Bullish
Timeframe : Weekly
The Central Volumes scanner detects abnormal volumes on the asset:
Abnormal volumes
Timeframe : 5 days
Abnormal volumes
Timeframe : 20 days
Abnormal volumes
Timeframe : 50 days
Technical
A technical analysis in Daily of this WHATS COOKING GP chart shows a strongly bullish trend. 85.71% of the signals given by moving averages are bullish. This strongly bullish trend is supported by the strong bullish signals given by short-term moving averages. An assessment of moving averages reveals several bullish signals that could impact this trend:
Bullish price crossover with Moving Average 20
Type : Bullish
Timeframe : Daily
Bullish price crossover with adaptative moving average 20
Type : Bullish
Timeframe : Daily
The technical indicators are bullish. There is still some doubt about the price increase.
Caution: the Central Indicators scanner currently detects an excess:
CCI indicator is overbought : over 100
Type : Neutral
Timeframe : Daily
Williams %R indicator is overbought : over -20
Type : Neutral
Timeframe : Daily
Pivot points : price is over resistance 3
Type : Neutral
Timeframe : Daily
Pivot points : price is over resistance 3
Type : Neutral
Timeframe : Weekly
RSI indicator is back over 50
Type : Bullish
Timeframe : Daily
Parabolic SAR indicator bullish reversal
Type : Bullish
Timeframe : Daily
Aroon indicator bullish trend
Type : Bullish
Timeframe : Daily
SuperTrend indicator bullish reversal
Type : Bullish
Timeframe : Daily
Momentum indicator is back over 0
Type : Bullish
Timeframe : Daily
Central Patterns, the market scanner focusing on chart patterns, resistances and supports found these results:
Horizontal resistance is broken
Type : Bullish
Timeframe : Daily
Resistance of channel is broken
Type : Bullish
Timeframe : Daily
No result was found by the Central Candlesticks scanner on Japanese candlesticks.
| S3 | S2 | S1 | Price | R1 | R2 | R3 | |
|---|---|---|---|---|---|---|---|
| ProTrendLines | 69.0 | 73.0 | 76.2 | 77.4 | 79.0 | 81.1 | 91.8 |
| Change (%) | -10.85% | -5.68% | -1.55% | - | +2.07% | +4.78% | +18.60% |
| Change | -8.4 | -4.4 | -1.2 | - | +1.6 | +3.7 | +14.4 |
| Level | Intermediate | Minor | Intermediate | - | Minor | Minor | Intermediate |
Pivot points can also be used to set your price objectives. Here is the price situation in relation to pivot points:
| Pivot points | S3 | S2 | S1 | PP | R1 | R2 | R3 |
|---|---|---|---|---|---|---|---|
| Standard | 65.6 | 66.4 | 66.8 | 67.6 | 68.0 | 68.8 | 69.2 |
| Camarilla | 66.9 | 67.0 | 67.1 | 67.2 | 67.3 | 67.4 | 67.5 |
| Woodie | 65.4 | 66.3 | 66.6 | 67.5 | 67.8 | 68.7 | 69.0 |
| Fibonacci | 66.4 | 66.9 | 67.1 | 67.6 | 68.1 | 68.3 | 68.8 |
| Pivot points | S3 | S2 | S1 | PP | R1 | R2 | R3 |
|---|---|---|---|---|---|---|---|
| Standard | 64.2 | 65.6 | 66.4 | 67.8 | 68.6 | 70.0 | 70.8 |
| Camarilla | 66.6 | 66.8 | 67.0 | 67.2 | 67.4 | 67.6 | 67.8 |
| Woodie | 63.9 | 65.5 | 66.1 | 67.7 | 68.3 | 69.9 | 70.5 |
| Fibonacci | 65.6 | 66.4 | 67.0 | 67.8 | 68.6 | 69.2 | 70.0 |
| Pivot points | S3 | S2 | S1 | PP | R1 | R2 | R3 |
|---|---|---|---|---|---|---|---|
| Standard | 42.7 | 49.5 | 61.3 | 68.1 | 79.9 | 86.7 | 98.5 |
| Camarilla | 67.9 | 69.6 | 71.3 | 73.0 | 74.7 | 76.4 | 78.1 |
| Woodie | 45.1 | 50.8 | 63.7 | 69.4 | 82.3 | 88.0 | 100.9 |
| Fibonacci | 49.5 | 56.6 | 61.0 | 68.1 | 75.2 | 79.6 | 86.7 |
Numerical data
The following is the status of technical indicators and moving averages registered at the time this technical analysis was created:
| RSI (14): | 69.50 | |
| MACD (12,26,9): | 1.5000 | |
| Directional Movement: | 33.0 | |
| AROON (14): | 64.3 | |
| DEMA (21): | 71.5 | |
| Parabolic SAR (0,02-0,02-0,2): | 66.8 | |
| Elder Ray (13): | 5.3 | |
| Super Trend (3,10): | 67.5 | |
| Zig ZAG (10): | 77.4 | |
| VORTEX (21): | 1.1000 | |
| Stochastique (14,3,5): | 33.70 | |
| TEMA (21): | 71.6 | |
| Williams %R (14): | -7.00 | |
| Chande Momentum Oscillator (20): | 2.8 | |
| Repulse (5,40,3): | 6.1000 | |
| ROCnROLL: | 1 | |
| TRIX (15,9): | 0.4000 | |
| Courbe Coppock: | 7.90 |
| MA7: | 69.6 | |
| MA20: | 71.4 | |
| MA50: | 65.0 | |
| MA100: | 65.4 | |
| MAexp7: | 70.6 | |
| MAexp20: | 69.3 | |
| MAexp50: | 67.1 | |
| MAexp100: | 67.2 | |
| Price / MA7: | +11.21% | |
| Price / MA20: | +8.40% | |
| Price / MA50: | +19.08% | |
| Price / MA100: | +18.35% | |
| Price / MAexp7: | +9.63% | |
| Price / MAexp20: | +11.69% | |
| Price / MAexp50: | +15.35% | |
| Price / MAexp100: | +15.18% |
News
Don't forget to follow the news on WHATS COOKING GP. At the time of publication of this analysis, the latest news was as follows:
About author
Online


Add a comment
Comments
0 comments on the analysis WHATS COOKING GP - Daily