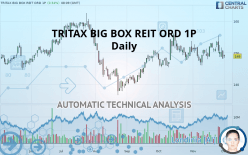
TRITAX BIG BOX REIT ORD 1P - Daily - Technical analysis published on 12/02/2019 (GMT)
- Who voted?
- 317
- 0
Click here for a new analysis!
- Timeframe : Daily
- - Analysis generated on
- Status : TARGET REACHED

Summary of the analysis

Additional analysis
Quotes
The TRITAX BIG BOX REIT ORD 1P price is 149.0 GBX. The price registered an increase of +0.54% on the session and was traded between 148.4 GBX and 149.4 GBX over the period. The price is currently at +0.40% from its lowest and -0.27% from its highest.A bullish opening was detected by the Central Gaps scanner. Buyers are trying to impose a bullish momentum in the very short term.
Bullish opening
Type : Bullish
Timeframe : Openning
A study of price movements over other periods shows the following variations:
Near a new HIGH record (5 years)
Type : Bullish
Timeframe : Weekly
Technical
A technical analysis in Daily of this TRITAX BIG BOX REIT ORD 1P chart shows a neutral trend. The strong bearish signals currently being given by short-term moving averages could allow the overall trend to return to a bearish trend. The Central Indicators market scanner is currently detecting several bearish signals that could impact this trend:
Bearish trend reversal : adaptative moving average 50
Type : Bearish
Timeframe : Daily
Bearish price crossover with adaptative moving average 50
Type : Bearish
Timeframe : Daily
Bearish price crossover with adaptative moving average 100
Type : Bearish
Timeframe : Daily
An assessment of technical indicators does not currently provide any relevant information to suggest whether the signal given by the technical indicators is more bullish or bearish.
Central Indicators, the detector scanner for these technical indicators has recently detected several signals:
Pivot points : price is under support 1
Type : Neutral
Timeframe : Daily
Pivot points : price is under support 1
Type : Neutral
Timeframe : Weekly
Price is back over the pivot point
Type : Bullish
Timeframe : Weekly
Momentum indicator is back under 0
Type : Bearish
Timeframe : Daily
An analysis of the price chart with the Central Patterns scanner (detector of chart patterns and resistances and supports) shows several results that can have an impact on the price change:
Near horizontal support
Type : Bullish
Timeframe : Daily
Near support of channel
Type : Bullish
Timeframe : Daily
Near support of triangle
Type : Bullish
Timeframe : Daily
No result was found by the Central Candlesticks scanner on Japanese candlesticks.
| S3 | S2 | S1 | Price | R1 | R2 | R3 | |
|---|---|---|---|---|---|---|---|
| ProTrendLines | 141.5 | 145.2 | 148.2 | 149.0 | 152.1 | 155.7 | 159.7 |
| Change (%) | -5.03% | -2.55% | -0.54% | - | +2.08% | +4.50% | +7.18% |
| Change | -7.5 | -3.8 | -0.8 | - | +3.1 | +6.7 | +10.7 |
| Level | Minor | Major | Major | - | Intermediate | Intermediate | Major |
Pivot points can also be used to set your price objectives. Here is the price situation in relation to pivot points:
| Pivot points | S3 | S2 | S1 | PP | R1 | R2 | R3 |
|---|---|---|---|---|---|---|---|
| Standard | 145.9 | 147.3 | 148.8 | 150.2 | 151.7 | 153.1 | 154.6 |
| Camarilla | 149.4 | 149.7 | 149.9 | 150.2 | 150.5 | 150.7 | 151.0 |
| Woodie | 145.9 | 147.3 | 148.8 | 150.2 | 151.7 | 153.1 | 154.6 |
| Fibonacci | 147.3 | 148.4 | 149.1 | 150.2 | 151.3 | 152.0 | 153.1 |
| Pivot points | S3 | S2 | S1 | PP | R1 | R2 | R3 |
|---|---|---|---|---|---|---|---|
| Standard | 144.5 | 146.6 | 148.9 | 151.0 | 153.3 | 155.4 | 157.7 |
| Camarilla | 149.9 | 150.3 | 150.7 | 151.1 | 151.5 | 151.9 | 152.3 |
| Woodie | 144.5 | 146.7 | 148.9 | 151.1 | 153.3 | 155.5 | 157.7 |
| Fibonacci | 146.6 | 148.3 | 149.4 | 151.0 | 152.7 | 153.8 | 155.4 |
| Pivot points | S3 | S2 | S1 | PP | R1 | R2 | R3 |
|---|---|---|---|---|---|---|---|
| Standard | 133.3 | 138.5 | 144.4 | 149.6 | 155.5 | 160.7 | 166.6 |
| Camarilla | 145.6 | 146.5 | 147.3 | 150.3 | 151.3 | 152.3 | 153.3 |
| Woodie | 134.0 | 140.0 | 143.5 | 149.5 | 153.0 | 159.0 | 162.5 |
| Fibonacci | 140.4 | 144.0 | 146.3 | 149.9 | 153.5 | 155.8 | 159.4 |
Numerical data
The following is the status of technical indicators and moving averages registered at the time this technical analysis was created:
| RSI (14): | 46.30 | |
| MACD (12,26,9): | 0.1000 | |
| Directional Movement: | -1.7 | |
| AROON (14): | 50.0 | |
| DEMA (21): | 150.6 | |
| Parabolic SAR (0,02-0,02-0,2): | 155.1 | |
| Elder Ray (13): | -1.3 | |
| Super Trend (3,10): | 146.4 | |
| Zig ZAG (10): | 149.0 | |
| VORTEX (21): | 0.9000 | |
| Stochastique (14,3,5): | 30.40 | |
| TEMA (21): | 150.4 | |
| Williams %R (14): | -97.30 | |
| Chande Momentum Oscillator (20): | -1.9 | |
| Repulse (5,40,3): | -2.6000 | |
| ROCnROLL: | 2 | |
| TRIX (15,9): | 0.1000 | |
| Courbe Coppock: | 1.70 |
| MA7: | 150.7 | |
| MA20: | 150.2 | |
| MA50: | 149.4 | |
| MA100: | 147.4 | |
| MAexp7: | 150.2 | |
| MAexp20: | 150.2 | |
| MAexp50: | 149.2 | |
| MAexp100: | 147.7 | |
| Price / MA7: | -1.13% | |
| Price / MA20: | -0.80% | |
| Price / MA50: | -0.27% | |
| Price / MA100: | +1.09% | |
| Price / MAexp7: | -0.80% | |
| Price / MAexp20: | -0.80% | |
| Price / MAexp50: | -0.13% | |
| Price / MAexp100: | +0.88% |
News
Don"t forget to follow the news on TRITAX BIG BOX REIT ORD 1P. At the time of publication of this analysis, the latest news was as follows:
 Tritax Big Box REIT
About author

Online


Add a comment
Comments
0 comments on the analysis TRITAX BIG BOX REIT ORD 1P - Daily