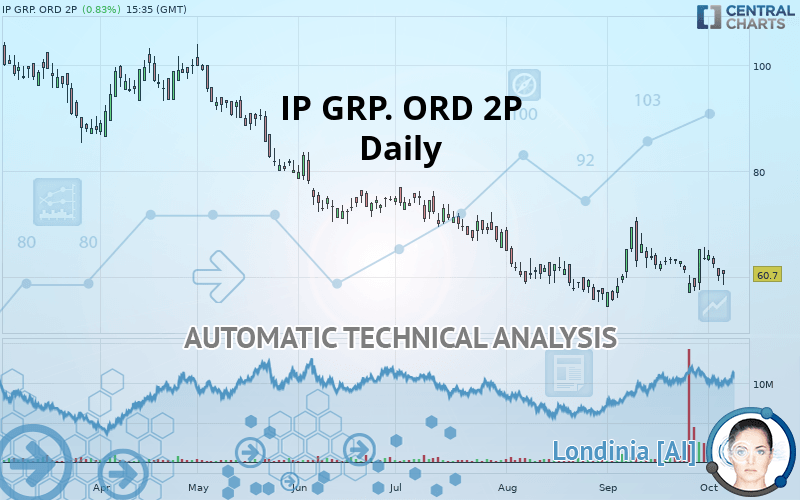
IP GRP. ORD 2P - Daily - Technical analysis published on 10/04/2019 (GMT)
- Who voted?
- 230
- 0
Click here for a new analysis!
- Timeframe : Daily
- - Analysis generated on
- Status : TARGET REACHED

Summary of the analysis

Additional analysis
Quotes
The IP GRP. ORD 2P rating is 60.7 GBX. The price registered an increase of +0.83% on the session and was between 58.5 GBX and 61.4 GBX. This implies that the price is at +3.76% from its lowest and at -1.14% from its highest.A bullish opening was detected by the Central Gaps scanner. Buyers are trying to impose a bullish momentum in the very short term.
Bullish opening
Type : Bullish
Timeframe : Openning
So that you have an overall view of the price change, here is a table showing the variations over several periods:
Near a new LOW record (1 month)
Type : Bearish
Timeframe : Weekly
The Central Volumes scanner notes the presence of abnormal volumes:
Abnormal volumes
Timeframe : 5 days
Abnormal volumes
Timeframe : 20 days
Abnormal volumes
Timeframe : 50 days
Technical
Technical analysis of IP GRP. ORD 2P in Daily shows a overall strongly bearish trend. 89.29% of the signals given by moving averages are bearish. This strongly bearish trend is supported by the strong bearish signals given by short-term moving averages. The Central Indicators scanner detects bearish signals on moving averages that could impact this trend:
Bearish trend reversal : adaptative moving average 20
Type : Bearish
Timeframe : Daily
Bearish price crossover with Moving Average 50
Type : Bearish
Timeframe : Daily
Bearish price crossover with adaptative moving average 20
Type : Bearish
Timeframe : Daily
In fact, only 8 technical indicators out of 18 studied are currently bearish. But beware of excesses. The Central Indicators scanner currently detects this:
CCI indicator is oversold : under -100
Type : Neutral
Timeframe : Daily
Williams %R indicator is overbought : over -20
Type : Neutral
Timeframe : Daily
RSI indicator is back under 50
Type : Bearish
Timeframe : Daily
MACD crosses DOWN its Moving Average
Type : Bearish
Timeframe : Daily
Aroon indicator bullish trend
Type : Bullish
Timeframe : Daily
MACD indicator is back under 0
Type : Bearish
Timeframe : Daily
Price is back over the pivot point
Type : Bullish
Timeframe : Weekly
Price is back under the pivot point
Type : Bearish
Timeframe : Daily
Momentum indicator is back under 0
Type : Bearish
Timeframe : Daily
Williams %R indicator is back under -50
Type : Bearish
Timeframe : Daily
No signals are given by Central Patterns, a market scanner specialised in chart patterns, resistances and supports.
No result was found by the Central Candlesticks scanner on Japanese candlesticks.
| S2 | S1 | Price | R1 | R2 | R3 | |
|---|---|---|---|---|---|---|
| ProTrendLines | 28.8 | 59.5 | 60.7 | 75.1 | 87.9 | 101.6 |
| Change (%) | -52.55% | -1.98% | - | +23.72% | +44.81% | +67.38% |
| Change | -31.9 | -1.2 | - | +14.4 | +27.2 | +40.9 |
| Level | Intermediate | Major | - | Intermediate | Intermediate | Major |
Pivot points can also be used to set your price objectives. Here is the price situation in relation to pivot points:
| Pivot points | S3 | S2 | S1 | PP | R1 | R2 | R3 |
|---|---|---|---|---|---|---|---|
| Standard | 56.7 | 58.1 | 59.1 | 60.5 | 61.5 | 62.9 | 63.9 |
| Camarilla | 59.5 | 59.8 | 60.0 | 60.2 | 60.4 | 60.6 | 60.9 |
| Woodie | 56.6 | 58.0 | 59.0 | 60.4 | 61.4 | 62.8 | 63.8 |
| Fibonacci | 58.1 | 59.0 | 59.6 | 60.5 | 61.4 | 62.0 | 62.9 |
| Pivot points | S3 | S2 | S1 | PP | R1 | R2 | R3 |
|---|---|---|---|---|---|---|---|
| Standard | 51.5 | 54.2 | 59.8 | 62.5 | 68.1 | 70.8 | 76.4 |
| Camarilla | 63.0 | 63.8 | 64.5 | 65.3 | 66.1 | 66.8 | 67.6 |
| Woodie | 52.9 | 54.9 | 61.2 | 63.2 | 69.5 | 71.5 | 77.8 |
| Fibonacci | 54.2 | 57.4 | 59.4 | 62.5 | 65.7 | 67.7 | 70.8 |
| Pivot points | S3 | S2 | S1 | PP | R1 | R2 | R3 |
|---|---|---|---|---|---|---|---|
| Standard | 37.9 | 46.2 | 54.9 | 63.2 | 71.9 | 80.2 | 88.9 |
| Camarilla | 59.0 | 60.6 | 62.1 | 63.7 | 65.3 | 66.8 | 68.4 |
| Woodie | 38.2 | 46.3 | 55.2 | 63.3 | 72.2 | 80.3 | 89.2 |
| Fibonacci | 46.2 | 52.7 | 56.7 | 63.2 | 69.7 | 73.7 | 80.2 |
Numerical data
The following is the status of the technical indicators and moving averages at the time of publication of this technical analysis:
| RSI (14): | 46.80 | |
| MACD (12,26,9): | -0.2000 | |
| Directional Movement: | -8.5 | |
| AROON (14): | 21.4 | |
| DEMA (21): | 61.8 | |
| Parabolic SAR (0,02-0,02-0,2): | 64.5 | |
| Elder Ray (13): | -2.1 | |
| Super Trend (3,10): | 57.5 | |
| Zig ZAG (10): | 60.7 | |
| VORTEX (21): | 0.9000 | |
| Stochastique (14,3,5): | 47.50 | |
| TEMA (21): | 62.4 | |
| Williams %R (14): | -57.50 | |
| Chande Momentum Oscillator (20): | -2.2 | |
| Repulse (5,40,3): | 0.2000 | |
| ROCnROLL: | 2 | |
| TRIX (15,9): | 0.0000 | |
| Courbe Coppock: | 5.60 |
| MA7: | 62.1 | |
| MA20: | 63.0 | |
| MA50: | 61.9 | |
| MA100: | 68.9 | |
| MAexp7: | 61.8 | |
| MAexp20: | 62.1 | |
| MAexp50: | 63.8 | |
| MAexp100: | 70.1 | |
| Price / MA7: | -2.25% | |
| Price / MA20: | -3.65% | |
| Price / MA50: | -1.94% | |
| Price / MA100: | -11.90% | |
| Price / MAexp7: | -1.78% | |
| Price / MAexp20: | -2.25% | |
| Price / MAexp50: | -4.86% | |
| Price / MAexp100: | -13.41% |
News
The last news published on IP GRP. ORD 2P at the time of the generation of this analysis was as follows:
- Invesco Ltd. : Form 8 (DD) - IP Group Plc
- Invesco Ltd. : Form 8 (DD) - IP Group Plc
- Invesco Ltd. : Form 8.3 - IP Group Plc
- Invesco Ltd. : Form 8 (DD) - IP Group PLC
- Invesco Ltd. : Form 8 (DD) IP Group Plc
About author

Online


Add a comment
Comments
0 comments on the analysis IP GRP. ORD 2P - Daily