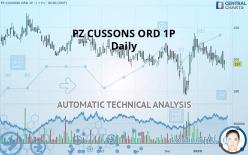
PZ CUSSONS ORD 1P - Daily - Technical analysis published on 01/29/2020 (GMT)
- Who voted?
- 252
- 0
Click here for a new analysis!
- Timeframe : Daily
- - Analysis generated on
- Status : TARGET REACHED

Summary of the analysis

Additional analysis
Quotes
PZ CUSSONS ORD 1P rating 197.0 GBX. On the day, this instrument lost +1.23% and was traded between 193.0 GBX and 199.2 GBX over the period. The price is currently at +2.07% from its lowest and -1.10% from its highest.A bullish gap was detected at the opening by the Central Gaps scanner. There are a lot of buyers and they have the upper hand in the very short term.
Opening Gap UP
Type : Bullish
Timeframe : Openning
So that you have an overall view of the price change, here is a table showing the variations over several periods:
Near a new HIGH record (1st january)
Type : Bullish
Timeframe : Weekly
Near a new HIGH record (1 month)
Type : Bullish
Timeframe : Weekly
Technical
Technical analysis of PZ CUSSONS ORD 1P in Daily shows a overall strongly bearish trend. The signals given by moving averages are 89.29% bearish. This strong bearish trend is confirmed by the strong signals currently being given by short-term moving averages. The Central Indicators market scanner is currently detecting several bullish signals that could impact this trend:
Bullish price crossover with Moving Average 50
Type : Bullish
Timeframe : Daily
Bullish price crossover with adaptative moving average 20
Type : Bullish
Timeframe : Daily
Bullish price crossover with adaptative moving average 50
Type : Bullish
Timeframe : Daily
An assessment of technical indicators shows a strong bearish signal.
Central Indicators, the detector scanner for these technical indicators has recently detected several signals:
Pivot points : price is under support 1
Type : Neutral
Timeframe : Daily
RSI indicator is back over 50
Type : Bullish
Timeframe : Daily
Ichimoku : price is over the cloud
Type : Bullish
Timeframe : Daily
Price is back over the pivot point
Type : Bullish
Timeframe : Daily
Price is back under the pivot point
Type : Bearish
Timeframe : Weekly
The Central Patterns scanner, which studies chart patterns, resistances and supports, has identified this signal:
Near horizontal support
Type : Bullish
Timeframe : Daily
For a small rebound in the very short term, the Central Candlesticks scanner currently notes the presence of this bullish pattern in Japanese candlesticks:
Bullish engulfing lines
Type : Bullish
Timeframe : Daily
| S3 | S2 | S1 | Price | R1 | R2 | R3 | |
|---|---|---|---|---|---|---|---|
| ProTrendLines | 150.3 | 179.3 | 193.4 | 197.0 | 202.0 | 212.4 | 219.9 |
| Change (%) | -23.71% | -8.98% | -1.83% | - | +2.54% | +7.82% | +11.62% |
| Change | -46.7 | -17.7 | -3.6 | - | +5.0 | +15.4 | +22.9 |
| Level | Minor | Major | Intermediate | - | Major | Intermediate | Minor |
Attention could also be paid to pivot points to set price objectives:
| Pivot points | S3 | S2 | S1 | PP | R1 | R2 | R3 |
|---|---|---|---|---|---|---|---|
| Standard | 191.7 | 194.2 | 197.9 | 200.4 | 204.1 | 206.6 | 210.3 |
| Camarilla | 199.8 | 200.4 | 200.9 | 201.5 | 202.1 | 202.6 | 203.2 |
| Woodie | 192.2 | 194.5 | 198.4 | 200.7 | 204.6 | 206.9 | 210.8 |
| Fibonacci | 194.2 | 196.6 | 198.1 | 200.4 | 202.8 | 204.3 | 206.6 |
| Pivot points | S3 | S2 | S1 | PP | R1 | R2 | R3 |
|---|---|---|---|---|---|---|---|
| Standard | 182.7 | 189.3 | 194.7 | 201.3 | 206.7 | 213.3 | 218.7 |
| Camarilla | 196.7 | 197.8 | 198.9 | 200.0 | 201.1 | 202.2 | 203.3 |
| Woodie | 182.0 | 189.0 | 194.0 | 201.0 | 206.0 | 213.0 | 218.0 |
| Fibonacci | 189.3 | 193.9 | 196.8 | 201.3 | 205.9 | 208.8 | 213.3 |
| Pivot points | S3 | S2 | S1 | PP | R1 | R2 | R3 |
|---|---|---|---|---|---|---|---|
| Standard | 145.0 | 161.1 | 184.3 | 200.4 | 223.6 | 239.7 | 262.9 |
| Camarilla | 196.7 | 200.3 | 203.9 | 207.5 | 211.1 | 214.7 | 218.3 |
| Woodie | 148.6 | 162.9 | 187.9 | 202.2 | 227.2 | 241.5 | 266.5 |
| Fibonacci | 161.1 | 176.1 | 185.4 | 200.4 | 215.4 | 224.7 | 239.7 |
Numerical data
The following is the status of technical indicators and moving averages registered at the time this technical analysis was created:
| RSI (14): | 42.20 | |
| MACD (12,26,9): | -0.6000 | |
| Directional Movement: | 1.9 | |
| AROON (14): | -92.9 | |
| DEMA (21): | 200.0 | |
| Parabolic SAR (0,02-0,02-0,2): | 213.8 | |
| Elder Ray (13): | -0.2 | |
| Super Trend (3,10): | 183.4 | |
| Zig ZAG (10): | 194.6 | |
| VORTEX (21): | 1.0000 | |
| Stochastique (14,3,5): | 16.30 | |
| TEMA (21): | 199.3 | |
| Williams %R (14): | -98.80 | |
| Chande Momentum Oscillator (20): | -10.4 | |
| Repulse (5,40,3): | -6.3000 | |
| ROCnROLL: | 2 | |
| TRIX (15,9): | 0.0000 | |
| Courbe Coppock: | 6.90 |
| MA7: | 199.3 | |
| MA20: | 202.9 | |
| MA50: | 200.0 | |
| MA100: | 203.0 | |
| MAexp7: | 198.9 | |
| MAexp20: | 200.3 | |
| MAexp50: | 200.9 | |
| MAexp100: | 202.4 | |
| Price / MA7: | -1.15% | |
| Price / MA20: | -2.91% | |
| Price / MA50: | -1.50% | |
| Price / MA100: | -2.96% | |
| Price / MAexp7: | -0.96% | |
| Price / MAexp20: | -1.65% | |
| Price / MAexp50: | -1.94% | |
| Price / MAexp100: | -2.67% |
News
The last news published on PZ CUSSONS ORD 1P at the time of the generation of this analysis was as follows:
 PZ Cussons
About author

Online


Add a comment
Comments
0 comments on the analysis PZ CUSSONS ORD 1P - Daily