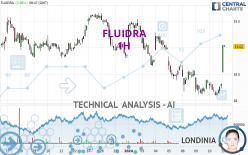
FLUIDRA - 1H - Technical analysis published on 01/11/2024 (GMT)
- 76
- 0
Click here for a new analysis!
- Timeframe : 1H
- - Analysis generated on
- Status : TARGET REACHED

Summary of the analysis

Additional analysis
Quotes
The FLUIDRA price is 19.02 EUR. The price has increased by +3.88% since the last closing with the lowest point at 18.53 EUR and the highest point at 19.03 EUR. The deviation from the price is +2.64% for the low point and -0.05% for the high point.The Central Gaps scanner detects a bullish gap which is a sign that buyers have taken the lead in the very short term.
Opening Gap UP
Type : Bullish
Timeframe : Openning
Here is a more detailed summary of the historical variations registered by FLUIDRA:
Near a new HIGH record (1st january)
Type : Bullish
Timeframe : Weekly
Near a new HIGH record (1 month)
Type : Bullish
Timeframe : Weekly
Technical
A technical analysis in 1H of this FLUIDRA chart shows a bullish trend. The signals returned by the moving averages are 71.43% bullish. This bullish trend is reinforced by the strong signals currently being given by short-term moving averages. An assessment of moving averages reveals several bullish signals that could impact this trend:
Bullish trend reversal : adaptative moving average 20
Type : Bullish
Timeframe : 1 hour
Bullish price crossover with Moving Average 50
Type : Bullish
Timeframe : 1 hour
Bullish price crossover with Moving Average 100
Type : Bullish
Timeframe : 1 hour
Bullish price crossover with adaptative moving average 20
Type : Bullish
Timeframe : 1 hour
Bullish price crossover with adaptative moving average 50
Type : Bullish
Timeframe : 1 hour
Bullish price crossover with adaptative moving average 100
Type : Bullish
Timeframe : 1 hour
The probability of a further increase is high given the direction of the technical indicators.
Caution: the Central Indicators scanner currently detects an excess:
RSI indicator is overbought : over 70
Type : Neutral
Timeframe : 1 hour
CCI indicator is overbought : over 100
Type : Neutral
Timeframe : 1 hour
Williams %R indicator is overbought : over -20
Type : Neutral
Timeframe : 1 hour
Pivot points : price is over resistance 3
Type : Neutral
Timeframe : 1 hour
Parabolic SAR indicator bullish reversal
Type : Bullish
Timeframe : 1 hour
Aroon indicator bullish trend
Type : Bullish
Timeframe : 1 hour
Ichimoku : price is over the cloud
Type : Bullish
Timeframe : 1 hour
SuperTrend indicator bullish reversal
Type : Bullish
Timeframe : 1 hour
Central Patterns, the market scanner focusing on chart patterns, resistances and supports found this result:
Near resistance of channel
Type : Bearish
Timeframe : 1 hour
For a small rebound in the very short term, the Central Candlesticks scanner currently notes the presence of these bullish patterns in Japanese candlesticks:
Upside gap
Type : Bullish
Timeframe : 1 hour
White marubozu
Type : Bullish
Timeframe : 1 hour
Long white line
Type : Bullish
Timeframe : 1 hour
| S3 | S2 | S1 | Price | R1 | R2 | R3 | |
|---|---|---|---|---|---|---|---|
| ProTrendLines | 18.12 | 18.41 | 18.80 | 19.02 | 19.29 | 19.56 | 20.37 |
| Change (%) | -4.73% | -3.21% | -1.16% | - | +1.42% | +2.84% | +7.10% |
| Change | -0.90 | -0.61 | -0.22 | - | +0.27 | +0.54 | +1.35 |
| Level | Intermediate | Intermediate | Major | - | Minor | Major | Minor |
Pivot points can also be used to set your price objectives. Here is the price situation in relation to pivot points:
| Pivot points | S3 | S2 | S1 | PP | R1 | R2 | R3 |
|---|---|---|---|---|---|---|---|
| Standard | 17.91 | 18.00 | 18.16 | 18.25 | 18.41 | 18.50 | 18.66 |
| Camarilla | 18.24 | 18.26 | 18.29 | 18.31 | 18.33 | 18.36 | 18.38 |
| Woodie | 17.94 | 18.02 | 18.19 | 18.27 | 18.44 | 18.52 | 18.69 |
| Fibonacci | 18.00 | 18.10 | 18.16 | 18.25 | 18.35 | 18.41 | 18.50 |
| Pivot points | S3 | S2 | S1 | PP | R1 | R2 | R3 |
|---|---|---|---|---|---|---|---|
| Standard | 17.03 | 17.70 | 18.19 | 18.86 | 19.35 | 20.02 | 20.51 |
| Camarilla | 18.35 | 18.46 | 18.56 | 18.67 | 18.78 | 18.88 | 18.99 |
| Woodie | 16.93 | 17.66 | 18.09 | 18.82 | 19.25 | 19.98 | 20.41 |
| Fibonacci | 17.70 | 18.15 | 18.42 | 18.86 | 19.31 | 19.58 | 20.02 |
| Pivot points | S3 | S2 | S1 | PP | R1 | R2 | R3 |
|---|---|---|---|---|---|---|---|
| Standard | 15.70 | 16.65 | 17.75 | 18.70 | 19.80 | 20.75 | 21.85 |
| Camarilla | 18.29 | 18.47 | 18.66 | 18.85 | 19.04 | 19.23 | 19.41 |
| Woodie | 15.78 | 16.69 | 17.83 | 18.74 | 19.88 | 20.79 | 21.93 |
| Fibonacci | 16.65 | 17.43 | 17.92 | 18.70 | 19.48 | 19.97 | 20.75 |
Numerical data
The following are the details of the technical indicators and moving averages that were collected to generate this technical analysis:
| RSI (14): | 71.01 | |
| MACD (12,26,9): | -0.0200 | |
| Directional Movement: | 26.29 | |
| AROON (14): | 35.71 | |
| DEMA (21): | 18.29 | |
| Parabolic SAR (0,02-0,02-0,2): | 18.10 | |
| Elder Ray (13): | 0.42 | |
| Super Trend (3,10): | 18.26 | |
| Zig ZAG (10): | 18.99 | |
| VORTEX (21): | 0.9200 | |
| Stochastique (14,3,5): | 73.98 | |
| TEMA (21): | 18.38 | |
| Williams %R (14): | -2.20 | |
| Chande Momentum Oscillator (20): | 0.79 | |
| Repulse (5,40,3): | 3.7400 | |
| ROCnROLL: | 1 | |
| TRIX (15,9): | -0.0800 | |
| Courbe Coppock: | 0.92 |
| MA7: | 18.66 | |
| MA20: | 18.83 | |
| MA50: | 18.34 | |
| MA100: | 18.36 | |
| MAexp7: | 18.42 | |
| MAexp20: | 18.36 | |
| MAexp50: | 18.52 | |
| MAexp100: | 18.70 | |
| Price / MA7: | +1.93% | |
| Price / MA20: | +1.01% | |
| Price / MA50: | +3.71% | |
| Price / MA100: | +3.59% | |
| Price / MAexp7: | +3.26% | |
| Price / MAexp20: | +3.59% | |
| Price / MAexp50: | +2.70% | |
| Price / MAexp100: | +1.71% |
News
The last news published on FLUIDRA at the time of the generation of this analysis was as follows:
- Fluidra Achieves Sales of €1,186 Million in the First Half of the Year
- Fluidra Achieves Sales of €554 Million in the First Quarter and Maintains Its 2023 Guidance
- Fluidra Proposes a Dividend Distribution of 0.70 Euros Per Share
- Fluidra Closed 2022 with €2,389 Million Sales, up 9% on 2021
- Fluidra Reaches an Agreement to Acquire Meranus Group
About author
Online


Add a comment
Comments
0 comments on the analysis FLUIDRA - 1H