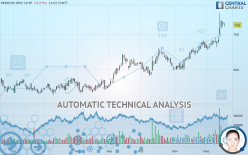
REDROW ORD 10.5P - Daily - Technical analysis published on 12/18/2019 (GMT)
- Who voted?
- 299
- 0
Click here for a new analysis!
- Timeframe : Daily
- - Analysis generated on
- Status : TARGET REACHED

Summary of the analysis

Additional analysis
Quotes
REDROW ORD 10.5P rating 726 GBX. On the day, this instrument lost -0.28% with the lowest point at 721 GBX and the highest point at 732 GBX. The deviation from the price is +0.69% for the low point and -0.82% for the high point.A bearish opening was detected by the Central Gaps scanner. Sellers are trying to impose a bearish trend in the very short term.
Bearish opening
Type : Bearish
Timeframe : Openning
Here is a more detailed summary of the historical variations registered by REDROW ORD 10.5P:
Near a new HIGH record (5 years)
Type : Bullish
Timeframe : Weekly
Near a new HIGH record (1st january)
Type : Bullish
Timeframe : Weekly
Near a new HIGH record (1 month)
Type : Bullish
Timeframe : Weekly
The Central Volumes scanner detects abnormal volumes on the asset:
Abnormal volumes
Timeframe : 5 days
Technical
Technical analysis of this Daily chart of REDROW ORD 10.5P indicates that the overall trend is strongly bullish. 92.86% of the signals given by moving averages are bullish. The overall trend is supported by the strong bullish signals from short-term moving averages. The Central Indicators scanner does not detect any result on moving averages that would impact this trend.
In fact, 15 technical indicators on 18 studied are currently bullish. Caution: the Central Indicators scanner currently detects an excess:
RSI indicator is overbought : over 70
Type : Neutral
Timeframe : Daily
CCI indicator is overbought : over 100
Type : Neutral
Timeframe : Daily
Previous candle closed over Bollinger bands
Type : Neutral
Timeframe : Daily
Williams %R indicator is overbought : over -20
Type : Neutral
Timeframe : Daily
Price is back over the pivot point
Type : Bullish
Timeframe : Weekly
An analysis of the price chart with the Central Patterns scanner (detector of chart patterns and resistances and supports) shows a result that can have an impact on the price change:
Near horizontal support
Type : Bullish
Timeframe : Daily
Central Candlesticks, the scanner specialised in Japanese candlesticks, detects a bearish signal that could support the hypothesis of a small drop in the very short term:
Bearish harami
Type : Bearish
Timeframe : Daily
| S3 | S2 | S1 | Price | R1 | |
|---|---|---|---|---|---|
| ProTrendLines | 639 | 664 | 681 | 726 | 727 |
| Change (%) | -11.98% | -8.54% | -6.20% | - | +0.14% |
| Change | -87 | -62 | -45 | - | +1 |
| Level | Intermediate | Major | Intermediate | - | Major |
Attention could also be paid to pivot points to set price objectives:
| Pivot points | S3 | S2 | S1 | PP | R1 | R2 | R3 |
|---|---|---|---|---|---|---|---|
| Standard | 707 | 714 | 721 | 728 | 735 | 742 | 749 |
| Camarilla | 724 | 725 | 727 | 728 | 729 | 731 | 732 |
| Woodie | 707 | 714 | 721 | 728 | 735 | 742 | 749 |
| Fibonacci | 714 | 719 | 723 | 728 | 733 | 737 | 742 |
| Pivot points | S3 | S2 | S1 | PP | R1 | R2 | R3 |
|---|---|---|---|---|---|---|---|
| Standard | 570 | 617 | 666 | 713 | 762 | 809 | 858 |
| Camarilla | 690 | 698 | 707 | 716 | 725 | 734 | 742 |
| Woodie | 572 | 618 | 668 | 714 | 764 | 810 | 860 |
| Fibonacci | 617 | 653 | 676 | 713 | 749 | 772 | 809 |
| Pivot points | S3 | S2 | S1 | PP | R1 | R2 | R3 |
|---|---|---|---|---|---|---|---|
| Standard | 525 | 562 | 611 | 648 | 697 | 734 | 783 |
| Camarilla | 637 | 645 | 653 | 661 | 669 | 677 | 685 |
| Woodie | 532 | 565 | 618 | 651 | 704 | 737 | 790 |
| Fibonacci | 562 | 595 | 615 | 648 | 681 | 701 | 734 |
Numerical data
The following is the status of technical indicators and moving averages registered at the time this technical analysis was created:
| RSI (14): | 75.00 | |
| MACD (12,26,9): | 22.0000 | |
| Directional Movement: | 31 | |
| AROON (14): | 58 | |
| DEMA (21): | 711 | |
| Parabolic SAR (0,02-0,02-0,2): | 681 | |
| Elder Ray (13): | 31 | |
| Super Trend (3,10): | 670 | |
| Zig ZAG (10): | 726 | |
| VORTEX (21): | 1.0000 | |
| Stochastique (14,3,5): | 72.00 | |
| TEMA (21): | 721 | |
| Williams %R (14): | -31.00 | |
| Chande Momentum Oscillator (20): | 65 | |
| Repulse (5,40,3): | 1.0000 | |
| ROCnROLL: | 1 | |
| TRIX (15,9): | 0.0000 | |
| Courbe Coppock: | 14.00 |
| MA7: | 706 | |
| MA20: | 680 | |
| MA50: | 648 | |
| MA100: | 608 | |
| MAexp7: | 711 | |
| MAexp20: | 685 | |
| MAexp50: | 653 | |
| MAexp100: | 622 | |
| Price / MA7: | +2.83% | |
| Price / MA20: | +6.76% | |
| Price / MA50: | +12.04% | |
| Price / MA100: | +19.41% | |
| Price / MAexp7: | +2.11% | |
| Price / MAexp20: | +5.99% | |
| Price / MAexp50: | +11.18% | |
| Price / MAexp100: | +16.72% |
News
The last news published on REDROW ORD 10.5P at the time of the generation of this analysis was as follows:
- Norges Bank - Form 8.3 - Redrow PLC
- HSBC Bank Plc : Form 8.5 (EPT/RI) - Redrow PLC
- HSBC Bank Plc : Form 8.5 (EPT/RI) - Redrow PLC
- HSBC Bank Plc : Form 8.5 (EPT/RI) - Redrow PLC
- HSBC Bank Plc : Form 8.5 (EPT/RI) - Redrow PLC
About author

Online


Add a comment
Comments
0 comments on the analysis REDROW ORD 10.5P - Daily