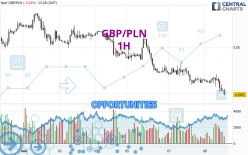
Londinia Opportunities Analyses - 05/08/2024 (GMT) GBP/PLN - 1H
- FX/Indices
- Timeframe : 1H
- - Analysis generated on
- Status : LEVEL MAINTAINED
Summary of the analysis

Additional analysis
Quotes
The GBP/PLN price is 4.9984 PLN. The price registered a decrease of -0.33% on the session and was traded between 4.9983 PLN and 5.0209 PLN over the period. The price is currently at +0.00% from its lowest and -0.45% from its highest.A bullish opening was detected by the Central Gaps scanner. Buyers are trying to impose a bullish momentum in the very short term.
Bullish opening
Type : Bullish
Timeframe : Openning
Here is a more detailed summary of the historical variations registered by GBP/PLN:
Near a new LOW record (1 year)
Type : Bearish
Timeframe : Weekly
Near a new HIGH record (1st january)
Type : Bullish
Timeframe : Weekly
Near a new HIGH record (1 month)
Type : Bullish
Timeframe : Weekly
Technical
A technical analysis in 1H of this GBP/PLN chart shows a sharp bearish trend. The signals given by moving averages are 92.86% bearish. This strong bearish trend is confirmed by the strong signals currently being given by short-term moving averages. The Central Indicators scanner does not detect any result on moving averages that would impact this trend.
An assessment of technical indicators shows a strong bearish signal.
Caution: the Central Indicators scanner currently detects an excess:
CCI indicator is oversold : under -100
Type : Neutral
Timeframe : 1 hour
Previous candle closed under Bollinger bands
Type : Neutral
Timeframe : 1 hour
Williams %R indicator is oversold : under -80
Type : Neutral
Timeframe : 1 hour
Pivot points : price is under support 1
Type : Neutral
Timeframe : 1 hour
Pivot points : price is under support 3
Type : Neutral
Timeframe : Weekly
An analysis of the price chart with the Central Patterns scanner (detector of chart patterns and resistances and supports) shows several results that can have an impact on the price change:
Near horizontal support
Type : Bullish
Timeframe : 1 hour
Near support of channel
Type : Bullish
Timeframe : 1 hour
The Central Candlesticks scanner, specialised in Japanese candlesticks, did not identify any signals.
| S3 | S2 | S1 | Price | R1 | R2 | R3 | |
|---|---|---|---|---|---|---|---|
| ProTrendLines | 4.5925 | 4.8056 | 4.9723 | 4.9984 | 5.0097 | 5.0322 | 5.0487 |
| Change (%) | -8.12% | -3.86% | -0.52% | - | +0.23% | +0.68% | +1.01% |
| Change | -0.4059 | -0.1928 | -0.0261 | - | +0.0113 | +0.0338 | +0.0503 |
| Level | Intermediate | Minor | Major | - | Intermediate | Minor | Major |
Attention could also be paid to pivot points to set price objectives:
| Pivot points | S3 | S2 | S1 | PP | R1 | R2 | R3 |
|---|---|---|---|---|---|---|---|
| Standard | 4.9832 | 4.9964 | 5.0057 | 5.0189 | 5.0282 | 5.0414 | 5.0507 |
| Camarilla | 5.0087 | 5.0108 | 5.0128 | 5.0149 | 5.0170 | 5.0190 | 5.0211 |
| Woodie | 4.9812 | 4.9954 | 5.0037 | 5.0179 | 5.0262 | 5.0404 | 5.0487 |
| Fibonacci | 4.9964 | 5.0050 | 5.0103 | 5.0189 | 5.0275 | 5.0328 | 5.0414 |
| Pivot points | S3 | S2 | S1 | PP | R1 | R2 | R3 |
|---|---|---|---|---|---|---|---|
| Standard | 4.9770 | 5.0078 | 5.0252 | 5.0560 | 5.0734 | 5.1042 | 5.1216 |
| Camarilla | 5.0295 | 5.0339 | 5.0383 | 5.0427 | 5.0471 | 5.0515 | 5.0560 |
| Woodie | 4.9704 | 5.0045 | 5.0186 | 5.0527 | 5.0668 | 5.1009 | 5.1150 |
| Fibonacci | 5.0078 | 5.0262 | 5.0376 | 5.0560 | 5.0744 | 5.0858 | 5.1042 |
| Pivot points | S3 | S2 | S1 | PP | R1 | R2 | R3 |
|---|---|---|---|---|---|---|---|
| Standard | 4.8174 | 4.8875 | 4.9800 | 5.0501 | 5.1426 | 5.2127 | 5.3052 |
| Camarilla | 5.0277 | 5.0426 | 5.0575 | 5.0724 | 5.0873 | 5.1022 | 5.1171 |
| Woodie | 4.8285 | 4.8931 | 4.9911 | 5.0557 | 5.1537 | 5.2183 | 5.3163 |
| Fibonacci | 4.8875 | 4.9497 | 4.9880 | 5.0501 | 5.1123 | 5.1506 | 5.2127 |
Numerical data
The following is the status of the technical indicators and moving averages at the time of publication of this technical analysis:
| RSI (14): | 27.83 | |
| MACD (12,26,9): | -0.0044 | |
| Directional Movement: | -21.5419 | |
| AROON (14): | -35.7143 | |
| DEMA (21): | 5.0062 | |
| Parabolic SAR (0,02-0,02-0,2): | 5.0198 | |
| Elder Ray (13): | -0.0071 | |
| Super Trend (3,10): | 5.0203 | |
| Zig ZAG (10): | 4.9993 | |
| VORTEX (21): | 0.8960 | |
| Stochastique (14,3,5): | 9.06 | |
| TEMA (21): | 5.0056 | |
| Williams %R (14): | -95.85 | |
| Chande Momentum Oscillator (20): | -0.0127 | |
| Repulse (5,40,3): | -0.1972 | |
| ROCnROLL: | 2 | |
| TRIX (15,9): | -0.0096 | |
| Courbe Coppock: | 0.26 |
| MA7: | 5.0397 | |
| MA20: | 5.0387 | |
| MA50: | 5.0301 | |
| MA100: | 5.0460 | |
| MAexp7: | 5.0065 | |
| MAexp20: | 5.0118 | |
| MAexp50: | 5.0202 | |
| MAexp100: | 5.0304 | |
| Price / MA7: | -0.82% | |
| Price / MA20: | -0.80% | |
| Price / MA50: | -0.63% | |
| Price / MA100: | -0.94% | |
| Price / MAexp7: | -0.16% | |
| Price / MAexp20: | -0.27% | |
| Price / MAexp50: | -0.43% | |
| Price / MAexp100: | -0.64% |