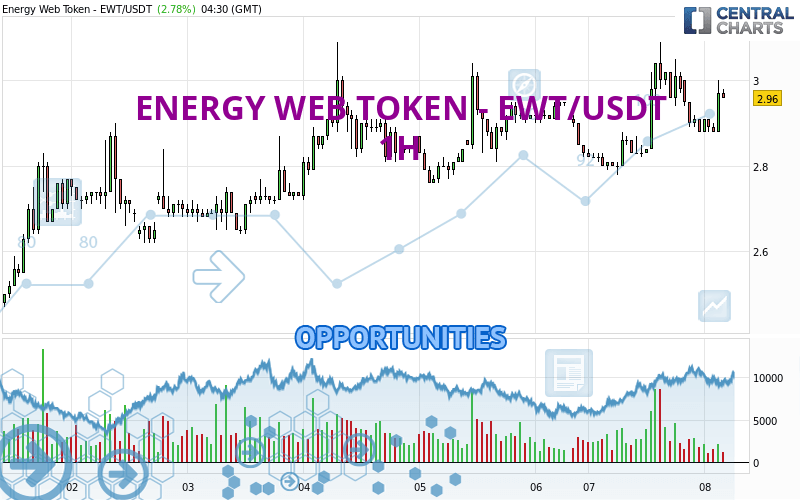
Londinia Opportunities Analyses - 05/08/2024 (GMT) ENERGY WEB TOKEN - EWT/USDT - 1H
| Type: | Cryptocurrencies |
| Ticker: | EWTUSDT |
| ISIN: |
I am delighted to see that my first price objective has been achieved. I hope you've taken advantage of it.
- Cryptocurrencies
- Timeframe : 1H
- - Analysis generated on
- Status : TARGET REACHED
Summary of the analysis
Trends
Short term:
Strongly bullish
Underlying:
Strongly bullish
Technical indicators
61%
22%
17%
My opinion
Bullish above 2.93 USDT
My targets
3.09 USDT (+4.04%)
3.53 USDT (+18.86%)
My analysis
ENERGY WEB TOKEN - EWT/USDT is part of a very strong bullish trend. Traders may consider trading only long positions (at the time of purchase) as long as the price remains well above 2.93 USDT. The next resistance located at 3.09 USDT is the next bullish objective to be reached. A bullish break in this resistance would boost the bullish momentum. The bullish movement could then continue towards the next resistance located at 3.53 USDT. After this resistance, buyers could then target 8.12 USDT. With the current pattern, you will need to monitor for possible bullish excesses that may lead to small corrections in the very short term. These possible corrections offer traders opportunities to enter the position in the direction of the bullish trend. Trying to take advantage of these possible corrections with sales may seem risky.
In the very short term, the general bullish sentiment is not called into question, despite technical indicators being indecisive.
Force
0
10
7.3

Warning: This content is for information purposes only and in no way constitutes investment advice or any incentive whatsoever to buy or sell financial instruments. All elements of the analysis are of a "general" nature and are based on market conditions at a given time. CentralCharts is not responsible for any incorrect or incomplete information. Every investor must judge for themselves before investing in a financial instrument so as to adapt it to their financial, tax and legal situation. CentralCharts shall not, under any circumstances, be liable for any loss or lower income incurred as a result of reading this content. Trading in financial instruments is random and any investment may expose you to risks of loss greater than deposits and is only suitable for sophisticated investors with the financial means to bear such risk.
Additional analysis
Quotes
The ENERGY WEB TOKEN - EWT/USDT rating is 2.97 USDT. The price has increased by +3.13% since the last closing and was between 2.88 USDT and 3.00 USDT. This implies that the price is at +3.13% from its lowest and at -1.00% from its highest.2.88
3.00
2.97
So that you have an overall view of the price change, here is a table showing the variations over several periods:
Near a new HIGH record (1 month)
Type : Bullish
Timeframe : Weekly
Technical
Technical analysis of this 1H chart of ENERGY WEB TOKEN - EWT/USDT indicates that the overall trend is strongly bullish. 92.86% of the signals given by moving averages are bullish. This strongly bullish trend is supported by the strong bullish signals given by short-term moving averages. An assessment of moving averages reveals several bullish signals that could impact this trend:
Bullish trend reversal : adaptative moving average 20
Type : Bullish
Timeframe : 1 hour
Bullish trend reversal : adaptative moving average 50
Type : Bullish
Timeframe : 1 hour
The technical indicators are generally neutral. They do not provide relevant information on the direction of future price movements.
Other results related to technical indicators were also found by the Central Indicators scanner:
MACD crosses UP its Moving Average
Type : Bullish
Timeframe : 1 hour
Aroon indicator bearish trend
Type : Bearish
Timeframe : 1 hour
The analysis of the price chart with Central Patterns scanners does not return any result.
Central Candlesticks, the scanner specialised in Japanese candlesticks, detects these bearish signals that could support the hypothesis of a small drop in the very short term:
Bearish harami
Type : Bearish
Timeframe : 1 hour
Bearish harami cross
Type : Bearish
Timeframe : 1 hour
ProTrendLines
S3
S2
S1
R1
R2
R3
Price
| S3 | S2 | S1 | Price | R1 | R2 | R3 | |
|---|---|---|---|---|---|---|---|
| ProTrendLines | 2.76 | 2.82 | 2.93 | 2.97 | 3.09 | 8.12 | 12.06 |
| Change (%) | -7.07% | -5.05% | -1.35% | - | +4.04% | +173.40% | +306.06% |
| Change | -0.21 | -0.15 | -0.04 | - | +0.12 | +5.15 | +9.09 |
| Level | Major | Minor | Major | - | Intermediate | Minor | Minor |
Attention could also be paid to pivot points to set price objectives:
Daily
| Pivot points | S3 | S2 | S1 | PP | R1 | R2 | R3 |
|---|---|---|---|---|---|---|---|
| Standard | 2.43 | 2.61 | 2.74 | 2.92 | 3.05 | 3.23 | 3.36 |
| Camarilla | 2.80 | 2.82 | 2.85 | 2.88 | 2.91 | 2.94 | 2.97 |
| Woodie | 2.42 | 2.60 | 2.73 | 2.91 | 3.04 | 3.22 | 3.35 |
| Fibonacci | 2.61 | 2.73 | 2.80 | 2.92 | 3.04 | 3.11 | 3.23 |
Weekly
| Pivot points | S3 | S2 | S1 | PP | R1 | R2 | R3 |
|---|---|---|---|---|---|---|---|
| Standard | 1.66 | 1.99 | 2.43 | 2.76 | 3.20 | 3.53 | 3.97 |
| Camarilla | 2.66 | 2.73 | 2.80 | 2.87 | 2.94 | 3.01 | 3.08 |
| Woodie | 1.72 | 2.02 | 2.49 | 2.79 | 3.26 | 3.56 | 4.03 |
| Fibonacci | 1.99 | 2.28 | 2.47 | 2.76 | 3.05 | 3.24 | 3.53 |
Monthly
| Pivot points | S3 | S2 | S1 | PP | R1 | R2 | R3 |
|---|---|---|---|---|---|---|---|
| Standard | 0.63 | 1.19 | 1.88 | 2.44 | 3.13 | 3.69 | 4.38 |
| Camarilla | 2.23 | 2.34 | 2.46 | 2.57 | 2.69 | 2.80 | 2.91 |
| Woodie | 0.70 | 1.22 | 1.95 | 2.47 | 3.20 | 3.72 | 4.45 |
| Fibonacci | 1.19 | 1.67 | 1.96 | 2.44 | 2.92 | 3.21 | 3.69 |
Numerical data
The following is the status of the technical indicators and moving averages at the time of publication of this technical analysis:
Technical indicators
Moving averages
| RSI (14): | 57.03 | |
| MACD (12,26,9): | 0.0100 | |
| Directional Movement: | 17.61 | |
| AROON (14): | -85.72 | |
| DEMA (21): | 2.94 | |
| Parabolic SAR (0,02-0,02-0,2): | 3.03 | |
| Elder Ray (13): | 0.05 | |
| Super Trend (3,10): | 2.87 | |
| Zig ZAG (10): | 2.97 | |
| VORTEX (21): | 1.1400 | |
| Stochastique (14,3,5): | 34.66 | |
| TEMA (21): | 2.94 | |
| Williams %R (14): | -58.46 | |
| Chande Momentum Oscillator (20): | -0.05 | |
| Repulse (5,40,3): | 1.2900 | |
| ROCnROLL: | 1 | |
| TRIX (15,9): | 0.0700 | |
| Courbe Coppock: | 0.04 |
| MA7: | 2.84 | |
| MA20: | 2.55 | |
| MA50: | 2.40 | |
| MA100: | 2.41 | |
| MAexp7: | 2.93 | |
| MAexp20: | 2.92 | |
| MAexp50: | 2.90 | |
| MAexp100: | 2.85 | |
| Price / MA7: | +4.58% | |
| Price / MA20: | +16.47% | |
| Price / MA50: | +23.75% | |
| Price / MA100: | +23.24% | |
| Price / MAexp7: | +1.37% | |
| Price / MAexp20: | +1.71% | |
| Price / MAexp50: | +2.41% | |
| Price / MAexp100: | +4.21% |
Quotes :
-
Real time data
-
Cryptocompare