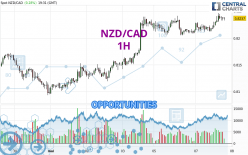
Londinia Opportunities Analyses - 05/07/2024 (GMT) NZD/CAD - 1H
I am pleased to note that the threshold for invalidation has been maintained for 20 Candlesticks.
- FX/Indices
- Timeframe : 1H
- - Analysis generated on
- Status : LEVEL MAINTAINED
Summary of the analysis
Trends
Short term:
Strongly bullish
Underlying:
Strongly bullish
Technical indicators
83%
0%
17%
My opinion
Bullish above 0.8206 CAD
My targets
0.8280 CAD (+0.0042)
0.8311 CAD (+0.0073)
My analysis
NZD/CAD is part of a very strong bullish trend. Traders may consider trading only long positions (at the time of purchase) as long as the price remains well above 0.8206 CAD. The next resistance located at 0.8280 CAD is the next bullish objective to be reached. A bullish break in this resistance would boost the bullish momentum. The bullish movement could then continue towards the next resistance located at 0.8311 CAD. After this resistance, buyers could then target 0.8391 CAD. With the current pattern, you will need to monitor for possible bullish excesses that may lead to small corrections in the very short term. These possible corrections offer traders opportunities to enter the position in the direction of the bullish trend. Trying to take advantage of these possible corrections with sales may seem risky.
Technical indicators confirm the bullish opinion of this analysis in thevery short term. However, be careful of excessive bullish movements. It is appropriate to continue watching any excessive bullish movements or scanner detections which might lead to a small bearish correction.
Force
0
10
8.8

Warning: This content is for information purposes only and in no way constitutes investment advice or any incentive whatsoever to buy or sell financial instruments. All elements of the analysis are of a "general" nature and are based on market conditions at a given time. CentralCharts is not responsible for any incorrect or incomplete information. Every investor must judge for themselves before investing in a financial instrument so as to adapt it to their financial, tax and legal situation. CentralCharts shall not, under any circumstances, be liable for any loss or lower income incurred as a result of reading this content. Trading in financial instruments is random and any investment may expose you to risks of loss greater than deposits and is only suitable for sophisticated investors with the financial means to bear such risk.
Additional analysis
Quotes
The NZD/CAD rating is 0.8238 CAD. The price registered an increase of +0.29% on the session and was between 0.8212 CAD and 0.8247 CAD. This implies that the price is at +0.32% from its lowest and at -0.11% from its highest.0.8212
0.8247
0.8238
The Central Gaps scanner detects a bullish opening. A small advantage for buyers in the very short term.
Bullish opening
Type : Bullish
Timeframe : Openning
A study of price movements over other periods shows the following variations:
Near a new HIGH record (1 year)
Type : Bullish
Timeframe : Weekly
Near a new HIGH record (1st january)
Type : Bullish
Timeframe : Weekly
Near a new LOW record (1 month)
Type : Bearish
Timeframe : Weekly
Technical
Technical analysis of NZD/CAD in 1H shows a strongly overall bullish trend. 92.86% of the signals given by moving averages are bullish. This strongly bullish trend is supported by the strong bullish signals given by short-term moving averages. There is no crossing of moving average by the price or crossing of moving averages between themselves.
Technical indicators are strongly bullish, suggesting that the price increase should continue.
The Central Indicators scanner found this result concerning these indicators:
Pivot points : price is over resistance 1
Type : Neutral
Timeframe : 1 hour
Central Patterns, the scanner specializing in chart patterns, did not identify any signals.
No result was found by the Central Candlesticks scanner on Japanese candlesticks.
ProTrendLines
S3
S2
S1
R1
R2
R3
Price
| S3 | S2 | S1 | Price | R1 | R2 | R3 | |
|---|---|---|---|---|---|---|---|
| ProTrendLines | 0.8150 | 0.8172 | 0.8206 | 0.8238 | 0.8241 | 0.8311 | 0.8391 |
| Change (%) | -1.07% | -0.80% | -0.39% | - | +0.04% | +0.89% | +1.86% |
| Change | -0.0088 | -0.0066 | -0.0032 | - | +0.0003 | +0.0073 | +0.0153 |
| Level | Minor | Minor | Major | - | Major | Minor | Major |
To determine price objectives, it is also possible to use the pivot points. Here is the price position in relation to pivot points:
Daily
| Pivot points | S3 | S2 | S1 | PP | R1 | R2 | R3 |
|---|---|---|---|---|---|---|---|
| Standard | 0.8162 | 0.8183 | 0.8199 | 0.8220 | 0.8236 | 0.8257 | 0.8273 |
| Camarilla | 0.8204 | 0.8207 | 0.8211 | 0.8214 | 0.8217 | 0.8221 | 0.8224 |
| Woodie | 0.8159 | 0.8182 | 0.8196 | 0.8219 | 0.8233 | 0.8256 | 0.8270 |
| Fibonacci | 0.8183 | 0.8198 | 0.8206 | 0.8220 | 0.8235 | 0.8243 | 0.8257 |
Weekly
| Pivot points | S3 | S2 | S1 | PP | R1 | R2 | R3 |
|---|---|---|---|---|---|---|---|
| Standard | 0.7986 | 0.8039 | 0.8133 | 0.8186 | 0.8280 | 0.8333 | 0.8427 |
| Camarilla | 0.8186 | 0.8199 | 0.8213 | 0.8226 | 0.8240 | 0.8253 | 0.8266 |
| Woodie | 0.8006 | 0.8049 | 0.8153 | 0.8196 | 0.8300 | 0.8343 | 0.8447 |
| Fibonacci | 0.8039 | 0.8096 | 0.8130 | 0.8186 | 0.8243 | 0.8277 | 0.8333 |
Monthly
| Pivot points | S3 | S2 | S1 | PP | R1 | R2 | R3 |
|---|---|---|---|---|---|---|---|
| Standard | 0.7841 | 0.7953 | 0.8025 | 0.8137 | 0.8209 | 0.8321 | 0.8393 |
| Camarilla | 0.8046 | 0.8063 | 0.8080 | 0.8097 | 0.8114 | 0.8131 | 0.8148 |
| Woodie | 0.7821 | 0.7943 | 0.8005 | 0.8127 | 0.8189 | 0.8311 | 0.8373 |
| Fibonacci | 0.7953 | 0.8023 | 0.8067 | 0.8137 | 0.8207 | 0.8251 | 0.8321 |
Numerical data
The following are the details of the technical indicators and moving averages that were collected to generate this technical analysis:
Technical indicators
Moving averages
| RSI (14): | 59.80 | |
| MACD (12,26,9): | 0.0006 | |
| Directional Movement: | 14.2136 | |
| AROON (14): | 64.2857 | |
| DEMA (21): | 0.8234 | |
| Parabolic SAR (0,02-0,02-0,2): | 0.8220 | |
| Elder Ray (13): | 0.0006 | |
| Super Trend (3,10): | 0.8210 | |
| Zig ZAG (10): | 0.8237 | |
| VORTEX (21): | 1.1238 | |
| Stochastique (14,3,5): | 73.33 | |
| TEMA (21): | 0.8236 | |
| Williams %R (14): | -28.57 | |
| Chande Momentum Oscillator (20): | 0.0017 | |
| Repulse (5,40,3): | 0.0322 | |
| ROCnROLL: | 1 | |
| TRIX (15,9): | 0.0065 | |
| Courbe Coppock: | 0.38 |
| MA7: | 0.8174 | |
| MA20: | 0.8153 | |
| MA50: | 0.8189 | |
| MA100: | 0.8239 | |
| MAexp7: | 0.8235 | |
| MAexp20: | 0.8228 | |
| MAexp50: | 0.8216 | |
| MAexp100: | 0.8196 | |
| Price / MA7: | +0.78% | |
| Price / MA20: | +1.04% | |
| Price / MA50: | +0.60% | |
| Price / MA100: | -0.01% | |
| Price / MAexp7: | +0.04% | |
| Price / MAexp20: | +0.12% | |
| Price / MAexp50: | +0.27% | |
| Price / MAexp100: | +0.51% |
Quotes :
-
Real time data
-
Forex
News
The last news published on NZD/CAD at the time of the generation of this analysis was as follows:
-
 Trading into 2024: Rules of Alternation in Elliot Wave using NZD/CAD
-
New Zealand Dollar Soars on RBNZ: NZD/USD, NZD/JPY, NZD/CAD Analysis
-
Quick Takes Video: Volatility vs Inevitability for USD/CAD, NZD/JPY, NZD/CAD
-
NZD/CAD To Potentially Reach Parity