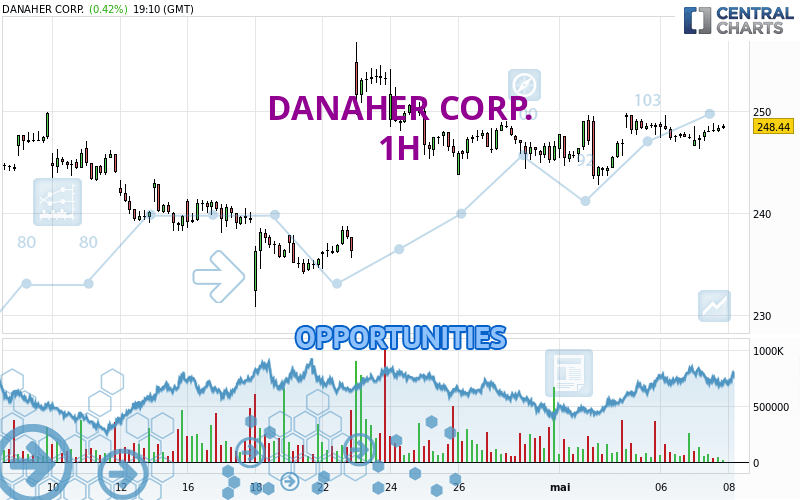
Londinia Opportunities Analyses - 05/07/2024 (GMT) DANAHER CORP. - 1H
I am delighted to see that my first price objective has been achieved. I hope you've taken advantage of it.
- U.S. Stocks
- Timeframe : 1H
- - Analysis generated on
- Status : TARGET REACHED
Summary of the analysis
Trends
Short term:
Strongly bullish
Underlying:
Strongly bullish
Technical indicators
72%
11%
17%
My opinion
Bullish above 247.04 USD
My targets
249.79 USD (+0.60%)
256.16 USD (+3.17%)
My analysis
All elements being clearly bullish, it would be possible for traders to trade only long positions (at the time of purchase) on DANAHER CORP. as long as the price remains well above 247.04 USD. The buyers' bullish objective is set at 249.79 USD. A bullish break in this resistance would boost the bullish momentum. The buyers could then target the resistance located at 256.16 USD. If there is any crossing, the next objective would be the resistance located at 266.36 USD. However, beware of bullish excesses that could lead to a possible short-term correction; but this possible correction would not be tradeable.
In the very short term, the general bullish sentiment is confirmed by technical indicators. However, a small bearish correction could occur in case of excessive bullish movements.
Force
0
10
8

Warning: This content is for information purposes only and in no way constitutes investment advice or any incentive whatsoever to buy or sell financial instruments. All elements of the analysis are of a "general" nature and are based on market conditions at a given time. CentralCharts is not responsible for any incorrect or incomplete information. Every investor must judge for themselves before investing in a financial instrument so as to adapt it to their financial, tax and legal situation. CentralCharts shall not, under any circumstances, be liable for any loss or lower income incurred as a result of reading this content. Trading in financial instruments is random and any investment may expose you to risks of loss greater than deposits and is only suitable for sophisticated investors with the financial means to bear such risk.
Additional analysis
Quotes
The DANAHER CORP. price is 248.30 USD. On the day, this instrument gained +0.36% and was between 246.20 USD and 248.75 USD. This implies that the price is at +0.85% from its lowest and at -0.18% from its highest.246.20
248.75
248.30
A bearish gap was detected at the opening by the Central Gaps scanner. There are a lot of sellers and they have the upper hand in the very short term.
Opening Gap DOWN
Type : Bearish
Timeframe : Openning
Here is a more detailed summary of the historical variations registered by DANAHER CORP.:
Near a new HIGH record (1 year)
Type : Bullish
Timeframe : Weekly
Near a new HIGH record (1st january)
Type : Bullish
Timeframe : Weekly
Near a new HIGH record (1 month)
Type : Bullish
Timeframe : Weekly
Technical
A technical analysis in 1H of this DANAHER CORP. chart shows a strongly bullish trend. The signals given by the moving averages are 92.86% bullish. This strong bullish trend is confirmed by the strong signals currently being given by short-term moving averages. There is no crossing of moving average by the price or crossing of moving averages between themselves.
In fact, 13 technical indicators on 18 studied are currently bullish. Central Indicators, the detector scanner for these technical indicators has recently detected several signals:
MACD crosses UP its Moving Average
Type : Bullish
Timeframe : 1 hour
Momentum indicator is back over 0
Type : Bullish
Timeframe : 1 hour
The Central Patterns scanner, which studies chart patterns, resistances and supports, has identified these signals:
Near horizontal resistance
Type : Bearish
Timeframe : 1 hour
Resistance of channel is broken
Type : Bullish
Timeframe : 1 hour
The Central Candlesticks scanner which studies Japanese candlesticks did not detect anything.
ProTrendLines
S3
S2
S1
R1
R2
R3
Price
| S3 | S2 | S1 | Price | R1 | R2 | R3 | |
|---|---|---|---|---|---|---|---|
| ProTrendLines | 238.09 | 242.63 | 247.04 | 248.30 | 249.79 | 256.16 | 266.36 |
| Change (%) | -4.11% | -2.28% | -0.51% | - | +0.60% | +3.17% | +7.27% |
| Change | -10.21 | -5.67 | -1.26 | - | +1.49 | +7.86 | +18.06 |
| Level | Minor | Major | Minor | - | Major | Major | Intermediate |
Attention could also be paid to pivot points to set price objectives:
Daily
| Pivot points | S3 | S2 | S1 | PP | R1 | R2 | R3 |
|---|---|---|---|---|---|---|---|
| Standard | 243.72 | 245.31 | 246.36 | 247.95 | 249.00 | 250.59 | 251.64 |
| Camarilla | 246.67 | 246.92 | 247.16 | 247.40 | 247.64 | 247.88 | 248.13 |
| Woodie | 243.44 | 245.18 | 246.08 | 247.82 | 248.72 | 250.46 | 251.36 |
| Fibonacci | 245.31 | 246.32 | 246.95 | 247.95 | 248.96 | 249.59 | 250.59 |
Weekly
| Pivot points | S3 | S2 | S1 | PP | R1 | R2 | R3 |
|---|---|---|---|---|---|---|---|
| Standard | 237.05 | 239.85 | 244.12 | 246.92 | 251.19 | 253.99 | 258.26 |
| Camarilla | 246.44 | 247.08 | 247.73 | 248.38 | 249.03 | 249.68 | 250.32 |
| Woodie | 237.78 | 240.22 | 244.85 | 247.29 | 251.92 | 254.36 | 258.99 |
| Fibonacci | 239.85 | 242.55 | 244.22 | 246.92 | 249.62 | 251.29 | 253.99 |
Monthly
| Pivot points | S3 | S2 | S1 | PP | R1 | R2 | R3 |
|---|---|---|---|---|---|---|---|
| Standard | 206.69 | 218.71 | 232.67 | 244.69 | 258.65 | 270.67 | 284.63 |
| Camarilla | 239.48 | 241.86 | 244.24 | 246.62 | 249.00 | 251.38 | 253.77 |
| Woodie | 207.65 | 219.20 | 233.63 | 245.18 | 259.61 | 271.16 | 285.59 |
| Fibonacci | 218.71 | 228.64 | 234.77 | 244.69 | 254.62 | 260.75 | 270.67 |
Numerical data
The following is the status of the technical indicators and moving averages at the time of publication of this technical analysis:
Technical indicators
Moving averages
| RSI (14): | 57.36 | |
| MACD (12,26,9): | 0.2900 | |
| Directional Movement: | 7.33 | |
| AROON (14): | -50.00 | |
| DEMA (21): | 248.03 | |
| Parabolic SAR (0,02-0,02-0,2): | 244.91 | |
| Elder Ray (13): | 0.44 | |
| Super Trend (3,10): | 250.04 | |
| Zig ZAG (10): | 248.27 | |
| VORTEX (21): | 1.0400 | |
| Stochastique (14,3,5): | 56.42 | |
| TEMA (21): | 248.02 | |
| Williams %R (14): | -37.01 | |
| Chande Momentum Oscillator (20): | 0.02 | |
| Repulse (5,40,3): | 0.1400 | |
| ROCnROLL: | 1 | |
| TRIX (15,9): | 0.0200 | |
| Courbe Coppock: | 0.40 |
| MA7: | 247.32 | |
| MA20: | 244.22 | |
| MA50: | 248.24 | |
| MA100: | 242.23 | |
| MAexp7: | 247.99 | |
| MAexp20: | 247.65 | |
| MAexp50: | 247.02 | |
| MAexp100: | 246.20 | |
| Price / MA7: | +0.40% | |
| Price / MA20: | +1.67% | |
| Price / MA50: | +0.02% | |
| Price / MA100: | +2.51% | |
| Price / MAexp7: | +0.11% | |
| Price / MAexp20: | +0.25% | |
| Price / MAexp50: | +0.51% | |
| Price / MAexp100: | +0.84% |
Quotes :
-
15 min delayed data
-
Actions NYSE
News
Don't forget to follow the news on DANAHER CORP.. At the time of publication of this analysis, the latest news was as follows:
- DEADLINE ACTION ALERT: The Schall Law Firm Encourages Investors in Danaher Corporation with Losses of $100,000 to Contact the Firm
- SHAREHOLDER ACTION NOTICE: The Schall Law Firm Encourages Investors in Danaher Corporation with Losses of $100,000 to Contact the Firm
- SHAREHOLDER ACTION ALERT: The Schall Law Firm Encourages Investors in Danaher Corporation with Losses of $100,000 to Contact the Firm
- SHAREHOLDER ACTION NOTICE: The Schall Law Firm Announces it is Investigating Claims Against Danaher Corporation and Encourages Investors with Losses to Contact the Firm
- INVESTOR ACTION NOTICE: The Schall Law Firm Announces it is Investigating Claims Against Danaher Corporation and Encourages Investors with Losses to Contact the Firm