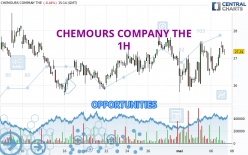
Londinia Opportunities Analyses - 05/07/2024 (GMT) CHEMOURS COMPANY THE - 1H
I am delighted to see that my first price objective has been achieved. I hope you've taken advantage of it.
- U.S. Stocks
- Timeframe : 1H
- - Analysis generated on
- Status : TARGET REACHED
Summary of the analysis
Trends
Short term:
Strongly bullish
Underlying:
Strongly bullish
Technical indicators
89%
0%
11%
My opinion
Bullish above 26.95 USD
My targets
27.80 USD (+1.87%)
28.19 USD (+3.30%)
My analysis
All elements being clearly bullish, it would be possible for traders to trade only long positions (at the time of purchase) on CHEMOURS COMPANY THE as long as the price remains well above 26.95 USD. The buyers' bullish objective is set at 27.80 USD. A bullish break in this resistance would boost the bullish momentum. The buyers could then target the resistance located at 28.19 USD. If there is any crossing, the next objective would be the resistance located at 28.67 USD. However, beware of bullish excesses that could lead to a possible short-term correction; but this possible correction would not be tradeable.
Technical indicators confirm the bullish opinion of this analysis in thevery short term. However, be careful of excessive bullish movements. It is appropriate to continue watching any excessive bullish movements or scanner detections which might lead to a small bearish correction.
Force
0
10
8.9

Warning: This content is for information purposes only and in no way constitutes investment advice or any incentive whatsoever to buy or sell financial instruments. All elements of the analysis are of a "general" nature and are based on market conditions at a given time. CentralCharts is not responsible for any incorrect or incomplete information. Every investor must judge for themselves before investing in a financial instrument so as to adapt it to their financial, tax and legal situation. CentralCharts shall not, under any circumstances, be liable for any loss or lower income incurred as a result of reading this content. Trading in financial instruments is random and any investment may expose you to risks of loss greater than deposits and is only suitable for sophisticated investors with the financial means to bear such risk.
Additional analysis
Quotes
CHEMOURS COMPANY THE rating 27.29 USD. The price is lower by -0.26% since the last closing and was between 27.16 USD and 27.60 USD. This implies that the price is at +0.48% from its lowest and at -1.12% from its highest.27.16
27.60
27.29
The Central Gaps scanner detects the formation of a bullish gap marking the strong presence of buyers against sellers at the opening. This formed a quotation gap.
Opening Gap UP
Type : Bullish
Timeframe : Openning
So that you have an overall view of the price change, here is a table showing the variations over several periods:
Near a new HIGH record (1 month)
Type : Bullish
Timeframe : Weekly
Technical
Technical analysis of CHEMOURS COMPANY THE in 1H shows a strongly overall bullish trend. 92.86% of the signals given by moving averages are bullish. The overall trend is supported by the strong bullish signals from short-term moving averages. The Central Indicators market scanner is currently detecting a bullish signal that could impact this trend:
Moving Average bullish crossovers : MA20 & MA50
Type : Bullish
Timeframe : 1 hour
In fact, 16 technical indicators on 18 studied are currently bullish. The Central Indicators scanner found this result concerning these indicators:
Momentum indicator is back under 0
Type : Bearish
Timeframe : 1 hour
An analysis of the price chart with the Central Patterns scanner (detector of chart patterns and resistances and supports) shows a result that can have an impact on the price change:
Near resistance of channel
Type : Bearish
Timeframe : 1 hour
For a small rebound in the very short term, the Central Candlesticks scanner currently notes the presence of this bullish pattern in Japanese candlesticks:
Bullish harami
Type : Bullish
Timeframe : 1 hour
ProTrendLines
S3
S2
S1
R1
R2
R3
Price
| S3 | S2 | S1 | Price | R1 | R2 | R3 | |
|---|---|---|---|---|---|---|---|
| ProTrendLines | 25.82 | 26.36 | 26.95 | 27.29 | 27.80 | 28.19 | 28.67 |
| Change (%) | -5.39% | -3.41% | -1.25% | - | +1.87% | +3.30% | +5.06% |
| Change | -1.47 | -0.93 | -0.34 | - | +0.51 | +0.90 | +1.38 |
| Level | Major | Major | Minor | - | Major | Minor | Major |
Pivot points can also be used to set your price objectives. Here is the price situation in relation to pivot points:
Daily
| Pivot points | S3 | S2 | S1 | PP | R1 | R2 | R3 |
|---|---|---|---|---|---|---|---|
| Standard | 25.83 | 26.14 | 26.75 | 27.06 | 27.67 | 27.98 | 28.59 |
| Camarilla | 27.11 | 27.19 | 27.28 | 27.36 | 27.44 | 27.53 | 27.61 |
| Woodie | 25.98 | 26.22 | 26.90 | 27.14 | 27.82 | 28.06 | 28.74 |
| Fibonacci | 26.14 | 26.49 | 26.71 | 27.06 | 27.41 | 27.63 | 27.98 |
Weekly
| Pivot points | S3 | S2 | S1 | PP | R1 | R2 | R3 |
|---|---|---|---|---|---|---|---|
| Standard | 23.54 | 24.64 | 25.61 | 26.71 | 27.68 | 28.78 | 29.75 |
| Camarilla | 26.00 | 26.19 | 26.38 | 26.57 | 26.76 | 26.95 | 27.14 |
| Woodie | 23.47 | 24.61 | 25.54 | 26.68 | 27.61 | 28.75 | 29.68 |
| Fibonacci | 24.64 | 25.43 | 25.92 | 26.71 | 27.50 | 27.99 | 28.78 |
Monthly
| Pivot points | S3 | S2 | S1 | PP | R1 | R2 | R3 |
|---|---|---|---|---|---|---|---|
| Standard | 21.81 | 23.72 | 25.24 | 27.15 | 28.67 | 30.58 | 32.10 |
| Camarilla | 25.81 | 26.12 | 26.44 | 26.75 | 27.06 | 27.38 | 27.69 |
| Woodie | 21.61 | 23.62 | 25.04 | 27.05 | 28.47 | 30.48 | 31.90 |
| Fibonacci | 23.72 | 25.03 | 25.84 | 27.15 | 28.46 | 29.27 | 30.58 |
Numerical data
The following are the details of the technical indicators and moving averages that were collected to generate this technical analysis:
Technical indicators
Moving averages
| RSI (14): | 56.03 | |
| MACD (12,26,9): | 0.1200 | |
| Directional Movement: | 9.47 | |
| AROON (14): | 57.14 | |
| DEMA (21): | 27.09 | |
| Parabolic SAR (0,02-0,02-0,2): | 26.31 | |
| Elder Ray (13): | 0.24 | |
| Super Trend (3,10): | 27.59 | |
| Zig ZAG (10): | 27.32 | |
| VORTEX (21): | 1.1000 | |
| Stochastique (14,3,5): | 76.40 | |
| TEMA (21): | 27.21 | |
| Williams %R (14): | -23.48 | |
| Chande Momentum Oscillator (20): | 0.11 | |
| Repulse (5,40,3): | 0.2400 | |
| ROCnROLL: | 1 | |
| TRIX (15,9): | 0.0300 | |
| Courbe Coppock: | 1.56 |
| MA7: | 26.83 | |
| MA20: | 26.74 | |
| MA50: | 26.46 | |
| MA100: | 28.29 | |
| MAexp7: | 27.15 | |
| MAexp20: | 26.96 | |
| MAexp50: | 26.88 | |
| MAexp100: | 26.87 | |
| Price / MA7: | +1.71% | |
| Price / MA20: | +2.06% | |
| Price / MA50: | +3.14% | |
| Price / MA100: | -3.53% | |
| Price / MAexp7: | +0.52% | |
| Price / MAexp20: | +1.22% | |
| Price / MAexp50: | +1.53% | |
| Price / MAexp100: | +1.56% |
Quotes :
-
15 min delayed data
-
Actions NYSE
News
Don't forget to follow the news on CHEMOURS COMPANY THE. At the time of publication of this analysis, the latest news was as follows:
- IMPORTANT SHAREHOLDER DEADLINE REMINDER: The Schall Law Firm Encourages Investors in The Chemours Company with Losses to Contact the Firm
- The Gross Law Firm Reminds Shareholders of a Lead Plaintiff Deadline of May 20, 2024 in The Chemours Company Lawsuit - CC
- The Chemours Company Investors Reminder: Kessler Topaz Meltzer & Check, LLP Reminds The Chemours Company Shareholders of Deadline in Securities Fraud Class Action Lawsuit (CC)
- The Chemours Company Sued for Securities Law Violations - Investors Should Contact Levi & Korsinsky Before May 20, 2024 to Discuss Your Rights - CC
- ROSEN, RECOGNIZED INVESTOR COUNSEL, Encourages The Chemours Company Investors to Secure Counsel Before Important Deadline in Securities Class Action - CC