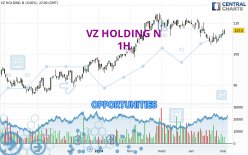
Londinia Opportunities Analyses - 05/06/2024 (GMT) VZ HOLDING N - 1H
-
CHF
(-)
-
15 min delayed data - Switzerland SWX Stocks
| Type: | Stocks |
| Ticker: | VZN |
| ISIN: | CH0528751586 |
I am delighted to see that my first price objective has been achieved. I hope you've taken advantage of it.
- Europe Stocks
- Timeframe : 1H
- - Analysis generated on
- Status : TARGET REACHED
Summary of the analysis
Trends
Short term:
Strongly bullish
Underlying:
Strongly bullish
Technical indicators
61%
6%
33%
My opinion
Bullish above 106.8 CHF
My targets
110.2 CHF (+2.04%)
112.0 CHF (+3.70%)
My analysis
All elements being clearly bullish, it would be possible for traders to trade only long positions (at the time of purchase) on VZ HOLDING N as long as the price remains well above 106.8 CHF. The buyers' bullish objective is set at 110.2 CHF. A bullish break in this resistance would boost the bullish momentum. The buyers could then target the resistance located at 112.0 CHF. If there is any crossing, the next objective would be the resistance located at 141.8 CHF. However, beware of bullish excesses that could lead to a possible short-term correction; but this possible correction would not be tradeable.
In the very short term, the general bullish sentiment is confirmed by technical indicators. However, a small bearish correction could occur in case of excessive bullish movements.
Force
0
10
7.9

Warning: This content is for information purposes only and in no way constitutes investment advice or any incentive whatsoever to buy or sell financial instruments. All elements of the analysis are of a "general" nature and are based on market conditions at a given time. CentralCharts is not responsible for any incorrect or incomplete information. Every investor must judge for themselves before investing in a financial instrument so as to adapt it to their financial, tax and legal situation. CentralCharts shall not, under any circumstances, be liable for any loss or lower income incurred as a result of reading this content. Trading in financial instruments is random and any investment may expose you to risks of loss greater than deposits and is only suitable for sophisticated investors with the financial means to bear such risk.
Additional analysis
Quotes
The VZ HOLDING N price is 108.0 CHF. On the day, this instrument gained +0.37% and was between 107.2 CHF and 108.0 CHF. This implies that the price is at +0.75% from its lowest and at 0% from its highest.107.2
108.0
108.0
A bullish opening was detected by the Central Gaps scanner. Buyers are trying to impose a bullish momentum in the very short term.
Bullish opening
Type : Bullish
Timeframe : Openning
A study of price movements over other periods shows the following variations:
Near a new HIGH record (1 year)
Type : Bullish
Timeframe : Weekly
Near a new HIGH record (1st january)
Type : Bullish
Timeframe : Weekly
Near a new LOW record (1 month)
Type : Bearish
Timeframe : Weekly
Technical
A technical analysis in 1H of this VZ HOLDING N chart shows a strongly bullish trend. 92.86% of the signals given by moving averages are bullish. The overall trend is supported by the strong bullish signals from short-term moving averages. An assessment of moving averages reveals a bullish signal that could impact this trend:
Moving Average bullish crossovers : AMA50 & AMA100
Type : Bullish
Timeframe : 1 hour
The technical indicators are bullish. There is still some doubt about the price increase.
But beware of excesses. The Central Indicators scanner currently detects this:
Williams %R indicator is overbought : over -20
Type : Neutral
Timeframe : 1 hour
An analysis of the price chart with the Central Patterns scanner (detector of chart patterns and resistances and supports) shows several results that can have an impact on the price change:
Near horizontal resistance
Type : Bearish
Timeframe : 1 hour
Near resistance of channel
Type : Bearish
Timeframe : 1 hour
The Central Candlesticks scanner which studies Japanese candlesticks did not detect anything.
ProTrendLines
S3
S2
S1
R1
R2
R3
Price
| S3 | S2 | S1 | R1 | Price | R2 | R3 | |
|---|---|---|---|---|---|---|---|
| ProTrendLines | 105.0 | 105.8 | 106.8 | 108.0 | 108.0 | 110.2 | 112.0 |
| Change (%) | -2.78% | -2.04% | -1.11% | 0% | - | +2.04% | +3.70% |
| Change | -3.0 | -2.2 | -1.2 | 0 | - | +2.2 | +4.0 |
| Level | Intermediate | Intermediate | Minor | Major | - | Minor | Major |
Attention could also be paid to pivot points to set price objectives:
Daily
| Pivot points | S3 | S2 | S1 | PP | R1 | R2 | R3 |
|---|---|---|---|---|---|---|---|
| Standard | 105.1 | 105.7 | 106.7 | 107.3 | 108.3 | 108.9 | 109.9 |
| Camarilla | 107.2 | 107.3 | 107.5 | 107.6 | 107.8 | 107.9 | 108.0 |
| Woodie | 105.2 | 105.8 | 106.8 | 107.4 | 108.4 | 109.0 | 110.0 |
| Fibonacci | 105.7 | 106.3 | 106.7 | 107.3 | 107.9 | 108.3 | 108.9 |
Weekly
| Pivot points | S3 | S2 | S1 | PP | R1 | R2 | R3 |
|---|---|---|---|---|---|---|---|
| Standard | 102.7 | 103.9 | 105.7 | 106.9 | 108.7 | 109.9 | 111.7 |
| Camarilla | 106.8 | 107.1 | 107.3 | 107.6 | 107.9 | 108.2 | 108.4 |
| Woodie | 103.1 | 104.1 | 106.1 | 107.1 | 109.1 | 110.1 | 112.1 |
| Fibonacci | 103.9 | 105.0 | 105.7 | 106.9 | 108.0 | 108.7 | 109.9 |
Monthly
| Pivot points | S3 | S2 | S1 | PP | R1 | R2 | R3 |
|---|---|---|---|---|---|---|---|
| Standard | 93.9 | 98.5 | 102.3 | 106.9 | 110.7 | 115.3 | 119.1 |
| Camarilla | 103.9 | 104.7 | 105.4 | 106.2 | 107.0 | 107.7 | 108.5 |
| Woodie | 93.6 | 98.3 | 102.0 | 106.7 | 110.4 | 115.1 | 118.8 |
| Fibonacci | 98.5 | 101.7 | 103.7 | 106.9 | 110.1 | 112.1 | 115.3 |
Numerical data
The following is the status of technical indicators and moving averages registered at the time this technical analysis was created:
Technical indicators
Moving averages
| RSI (14): | 68.10 | |
| MACD (12,26,9): | 0.5000 | |
| Directional Movement: | 20.6 | |
| AROON (14): | 50.0 | |
| DEMA (21): | 107.8 | |
| Parabolic SAR (0,02-0,02-0,2): | 106.7 | |
| Elder Ray (13): | 0.2 | |
| Super Trend (3,10): | 106.6 | |
| Zig ZAG (10): | 107.8 | |
| VORTEX (21): | 1.1000 | |
| Stochastique (14,3,5): | 83.80 | |
| TEMA (21): | 107.9 | |
| Williams %R (14): | -12.50 | |
| Chande Momentum Oscillator (20): | 1.2 | |
| Repulse (5,40,3): | 0.4000 | |
| ROCnROLL: | 1 | |
| TRIX (15,9): | 0.1000 | |
| Courbe Coppock: | 2.30 |
| MA7: | 106.0 | |
| MA20: | 106.2 | |
| MA50: | 108.4 | |
| MA100: | 104.0 | |
| MAexp7: | 107.6 | |
| MAexp20: | 107.2 | |
| MAexp50: | 106.4 | |
| MAexp100: | 106.2 | |
| Price / MA7: | +1.89% | |
| Price / MA20: | +1.69% | |
| Price / MA50: | -0.37% | |
| Price / MA100: | +3.85% | |
| Price / MAexp7: | +0.37% | |
| Price / MAexp20: | +0.75% | |
| Price / MAexp50: | +1.50% | |
| Price / MAexp100: | +1.69% |
Quotes :
-
15 min delayed data
-
Actions Suisse SWX
News
The last news published on VZ HOLDING N at the time of the generation of this analysis was as follows:
- VZ Holding AG: VZ shareholders approve all Board of Director’s motions
- VZ Holding AG: Above-average growth for VZ Group
- SHAREHOLDER ALERT: Pomerantz Law Firm Investigates Claims On Behalf of Investors of Verizon Communications Inc. - VZ
- SHAREHOLDER ALERT: The Gross Law Firm Notifies Shareholders of Verizon Communications Inc. of a Class Action Lawsuit and a Lead Plaintiff Deadline of October 2, 2023 - (NYSE: VZ)
- SHAREHOLDER ALERT: The Gross Law Firm Notifies Shareholders of Verizon Communications Inc. of a Class Action Lawsuit and a Lead Plaintiff Deadline of October 2, 2023 - (NYSE: VZ)