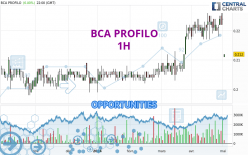
Londinia Opportunities Analyses - 05/06/2024 (GMT) BCA PROFILO - 1H
| Type: | Stocks |
| Ticker: | PRO |
| ISIN: | IT0001073045 |
- Europe Stocks
- Timeframe : 1H
- - Analysis generated on
- Status : TARGET REACHED
Summary of the analysis

Additional analysis
Quotes
The BCA PROFILO price is 0.213 EUR. On the day, this instrument gained +6.50% and was traded between 0.211 EUR and 0.213 EUR over the period. The price is currently at +0.95% from its lowest and 0% from its highest.The Central Gaps scanner detects a bullish gap which is a sign that buyers have taken the lead in the very short term.
Opening Gap UP
Type : Bullish
Timeframe : Openning
So that you have an overall view of the price change, here is a table showing the variations over several periods:
Near a new HIGH record (5 years)
Type : Bullish
Timeframe : Weekly
Near a new HIGH record (1 year)
Type : Bullish
Timeframe : Weekly
New HIGH record (1st january)
Type : Bullish
Timeframe : Weekly
New HIGH record (1 month)
Type : Bullish
Timeframe : Weekly
Abnormal volumes on BCA PROFILO were detected by the Central Volumes scanner:
Abnormal volumes
Timeframe : 5 days
Abnormal volumes
Timeframe : 20 days
Abnormal volumes
Timeframe : 50 days
Technical
Technical analysis of BCA PROFILO in 1H shows a strongly overall bullish trend. 92.86% of the signals given by moving averages are bullish. The overall trend is supported by the strong bullish signals from short-term moving averages. There is no crossing of moving average by the price or crossing of moving averages between themselves.
In fact, according to the parameters integrated into the Central Analyzer system, 14 technical indicators out of 18 analysed are currently bullish. Caution: the Central Indicators scanner currently detects an excess:
Williams %R indicator is overbought : over -20
Type : Neutral
Timeframe : 1 hour
Pivot points : price is over resistance 2
Type : Neutral
Timeframe : 1 hour
Pivot points : price is over resistance 2
Type : Neutral
Timeframe : Weekly
The Central Patterns scanner, which studies chart patterns, resistances and supports, has identified this signal:
Resistance of channel is broken
Type : Bullish
Timeframe : 1 hour
The Central Candlesticks scanner currently notes the presence of this pattern in Japanese candlesticks that could mark the end of the short-term trend currently underway:
Doji
Type : Neutral
Timeframe : 1 hour
| S3 | S2 | S1 | Price | R1 | R2 | R3 | |
|---|---|---|---|---|---|---|---|
| ProTrendLines | 0.208 | 0.210 | 0.211 | 0.213 | 0.214 | 0.303 | 0.350 |
| Change (%) | -2.35% | -1.41% | -0.94% | - | +0.47% | +42.25% | +64.32% |
| Change | -0.005 | -0.003 | -0.002 | - | +0.001 | +0.090 | +0.137 |
| Level | Intermediate | Minor | Intermediate | - | Major | Minor | Intermediate |
To determine price objectives, it is also possible to use the pivot points. Here is the price position in relation to pivot points:
| Pivot points | S3 | S2 | S1 | PP | R1 | R2 | R3 |
|---|---|---|---|---|---|---|---|
| Standard | 0.205 | 0.206 | 0.208 | 0.209 | 0.211 | 0.212 | 0.214 |
| Camarilla | 0.208 | 0.209 | 0.209 | 0.209 | 0.209 | 0.210 | 0.210 |
| Woodie | 0.205 | 0.206 | 0.208 | 0.209 | 0.211 | 0.212 | 0.214 |
| Fibonacci | 0.206 | 0.208 | 0.208 | 0.209 | 0.211 | 0.211 | 0.212 |
| Pivot points | S3 | S2 | S1 | PP | R1 | R2 | R3 |
|---|---|---|---|---|---|---|---|
| Standard | 0.203 | 0.205 | 0.207 | 0.209 | 0.211 | 0.213 | 0.215 |
| Camarilla | 0.208 | 0.208 | 0.209 | 0.209 | 0.209 | 0.210 | 0.210 |
| Woodie | 0.203 | 0.205 | 0.207 | 0.209 | 0.211 | 0.213 | 0.215 |
| Fibonacci | 0.205 | 0.207 | 0.208 | 0.209 | 0.211 | 0.212 | 0.213 |
| Pivot points | S3 | S2 | S1 | PP | R1 | R2 | R3 |
|---|---|---|---|---|---|---|---|
| Standard | 0.193 | 0.198 | 0.202 | 0.207 | 0.211 | 0.216 | 0.220 |
| Camarilla | 0.205 | 0.205 | 0.206 | 0.207 | 0.208 | 0.209 | 0.210 |
| Woodie | 0.194 | 0.198 | 0.203 | 0.207 | 0.212 | 0.216 | 0.221 |
| Fibonacci | 0.198 | 0.201 | 0.203 | 0.207 | 0.210 | 0.212 | 0.216 |
Numerical data
The following is the status of the technical indicators and moving averages at the time of publication of this technical analysis:
| RSI (14): | 64.12 | |
| MACD (12,26,9): | 0.0010 | |
| Directional Movement: | 3.294 | |
| AROON (14): | 57.143 | |
| DEMA (21): | 0.212 | |
| Parabolic SAR (0,02-0,02-0,2): | 0.209 | |
| Elder Ray (13): | 0 | |
| Super Trend (3,10): | 0.208 | |
| Zig ZAG (10): | 0.213 | |
| VORTEX (21): | 0.9390 | |
| Stochastique (14,3,5): | 100.00 | |
| TEMA (21): | 0.213 | |
| Williams %R (14): | 0.00 | |
| Chande Momentum Oscillator (20): | 0.005 | |
| Repulse (5,40,3): | 1.1120 | |
| ROCnROLL: | 1 | |
| TRIX (15,9): | 0.0550 | |
| Courbe Coppock: | 3.28 |
| MA7: | 0.208 | |
| MA20: | 0.207 | |
| MA50: | 0.201 | |
| MA100: | 0.196 | |
| MAexp7: | 0.212 | |
| MAexp20: | 0.211 | |
| MAexp50: | 0.210 | |
| MAexp100: | 0.208 | |
| Price / MA7: | +2.40% | |
| Price / MA20: | +2.90% | |
| Price / MA50: | +5.97% | |
| Price / MA100: | +8.67% | |
| Price / MAexp7: | +0.47% | |
| Price / MAexp20: | +0.95% | |
| Price / MAexp50: | +1.43% | |
| Price / MAexp100: | +2.40% |