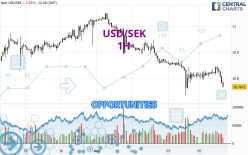
Londinia Opportunities Analyses - 05/06/2024 (GMT) USD/SEK - 1H
- FX/Indices
- Timeframe : 1H
- - Analysis generated on
- Status : INVALID
Summary of the analysis
Additional analysis
Quotes
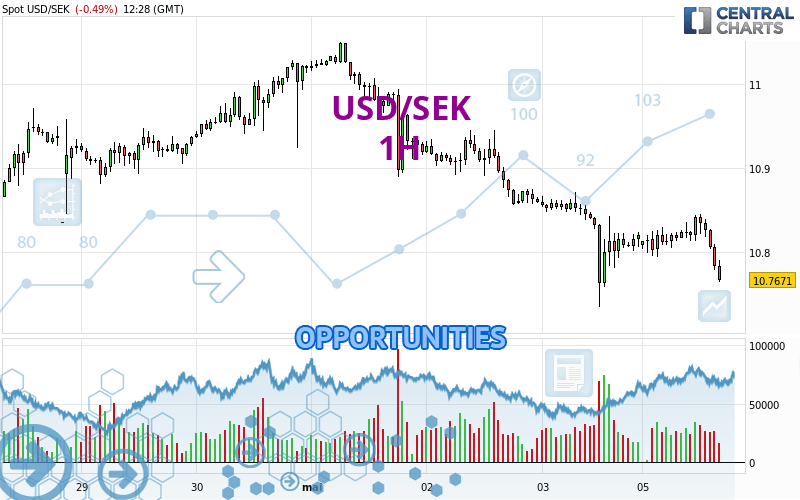
USD/SEK rating 10.7662 SEK. On the day, this instrument lost -0.50% and was between 10.7645 SEK and 10.8452 SEK. This implies that the price is at +0.02% from its lowest and at -0.73% from its highest.The Central Gaps scanner detects a bearish opening. A small advantage for sellers in the very short term.
Bearish opening
Type : Bearish
Timeframe : Openning
A study of price movements over other periods shows the following variations:
Near a new HIGH record (1 year)
Type : Bullish
Timeframe : Weekly
Near a new HIGH record (1st january)
Type : Bullish
Timeframe : Weekly
Near a new LOW record (1 month)
Type : Bearish
Timeframe : Weekly
Technical
A technical analysis in 1H of this USD/SEK chart shows a sharp bearish trend. 92.86% of the signals given by moving averages are bearish. The overall trend is supported by the strong bearish signals from short-term moving averages. The Central Indicators market scanner is currently detecting a bearish signal that could impact this trend:
Bearish trend reversal : Moving Average 20
Type : Bearish
Timeframe : 1 hour
In fact, 13 technical indicators on 18 studied are currently positioned bearish. Caution: the Central Indicators scanner currently detects an excess:
CCI indicator is oversold : under -100
Type : Neutral
Timeframe : 1 hour
Previous candle closed under Bollinger bands
Type : Neutral
Timeframe : 1 hour
Williams %R indicator is oversold : under -80
Type : Neutral
Timeframe : 1 hour
MACD crosses DOWN its Moving Average
Type : Bearish
Timeframe : 1 hour
Central Patterns, the scanner specializing in chart patterns, did not identify any signals.
Central Candlesticks, the scanner specialised in Japanese candlesticks, detects these signals that could have an impact on the current short-term trend:
Bullish harami
Type : Bullish
Timeframe : 1 hour
Three black crows
Type : Bearish
Timeframe : 1 hour
| S3 | S2 | S1 | Price | R1 | R2 | R3 | |
|---|---|---|---|---|---|---|---|
| ProTrendLines | 10.2079 | 10.4312 | 10.7348 | 10.7662 | 10.7844 | 10.8089 | 10.8353 |
| Change (%) | -5.19% | -3.11% | -0.29% | - | +0.17% | +0.40% | +0.64% |
| Change | -0.5583 | -0.3350 | -0.0314 | - | +0.0182 | +0.0427 | +0.0691 |
| Level | Minor | Major | Intermediate | - | Minor | Intermediate | Intermediate |
To determine price objectives, it is also possible to use the pivot points. Here is the price position in relation to pivot points:
| Pivot points | S3 | S2 | S1 | PP | R1 | R2 | R3 |
|---|---|---|---|---|---|---|---|
| Standard | 10.6093 | 10.6720 | 10.7460 | 10.8087 | 10.8827 | 10.9454 | 11.0194 |
| Camarilla | 10.7823 | 10.7948 | 10.8074 | 10.8199 | 10.8324 | 10.8450 | 10.8575 |
| Woodie | 10.6149 | 10.6748 | 10.7516 | 10.8115 | 10.8883 | 10.9482 | 11.0250 |
| Fibonacci | 10.6720 | 10.7243 | 10.7565 | 10.8087 | 10.8610 | 10.8932 | 10.9454 |
| Pivot points | S3 | S2 | S1 | PP | R1 | R2 | R3 |
|---|---|---|---|---|---|---|---|
| Standard | 10.3715 | 10.5532 | 10.6865 | 10.8682 | 11.0015 | 11.1832 | 11.3165 |
| Camarilla | 10.7333 | 10.7622 | 10.7910 | 10.8199 | 10.8488 | 10.8777 | 10.9065 |
| Woodie | 10.3474 | 10.5411 | 10.6624 | 10.8561 | 10.9774 | 11.1711 | 11.2924 |
| Fibonacci | 10.5532 | 10.6735 | 10.7478 | 10.8682 | 10.9885 | 11.0628 | 11.1832 |
| Pivot points | S3 | S2 | S1 | PP | R1 | R2 | R3 |
|---|---|---|---|---|---|---|---|
| Standard | 10.1330 | 10.3150 | 10.6666 | 10.8486 | 11.2002 | 11.3822 | 11.7338 |
| Camarilla | 10.8716 | 10.9205 | 10.9694 | 11.0183 | 11.0672 | 11.1161 | 11.1650 |
| Woodie | 10.2179 | 10.3574 | 10.7515 | 10.8910 | 11.2851 | 11.4246 | 11.8187 |
| Fibonacci | 10.3150 | 10.5188 | 10.6447 | 10.8486 | 11.0524 | 11.1783 | 11.3822 |
Numerical data
The following is the status of the technical indicators and moving averages at the time of publication of this technical analysis:
| RSI (14): | 34.58 | |
| MACD (12,26,9): | -0.0100 | |
| Directional Movement: | -9.5733 | |
| AROON (14): | -28.5714 | |
| DEMA (21): | 10.8019 | |
| Parabolic SAR (0,02-0,02-0,2): | 10.8439 | |
| Elder Ray (13): | -0.0264 | |
| Super Trend (3,10): | 10.8482 | |
| Zig ZAG (10): | 10.7785 | |
| VORTEX (21): | 0.9452 | |
| Stochastique (14,3,5): | 9.74 | |
| TEMA (21): | 10.8055 | |
| Williams %R (14): | -99.27 | |
| Chande Momentum Oscillator (20): | -0.0348 | |
| Repulse (5,40,3): | -0.4096 | |
| ROCnROLL: | 2 | |
| TRIX (15,9): | -0.0102 | |
| Courbe Coppock: | 0.08 |
| MA7: | 10.8941 | |
| MA20: | 10.8648 | |
| MA50: | 10.6187 | |
| MA100: | 10.4758 | |
| MAexp7: | 10.8008 | |
| MAexp20: | 10.8153 | |
| MAexp50: | 10.8415 | |
| MAexp100: | 10.8723 | |
| Price / MA7: | -1.17% | |
| Price / MA20: | -0.91% | |
| Price / MA50: | +1.39% | |
| Price / MA100: | +2.77% | |
| Price / MAexp7: | -0.32% | |
| Price / MAexp20: | -0.45% | |
| Price / MAexp50: | -0.69% | |
| Price / MAexp100: | -0.97% |