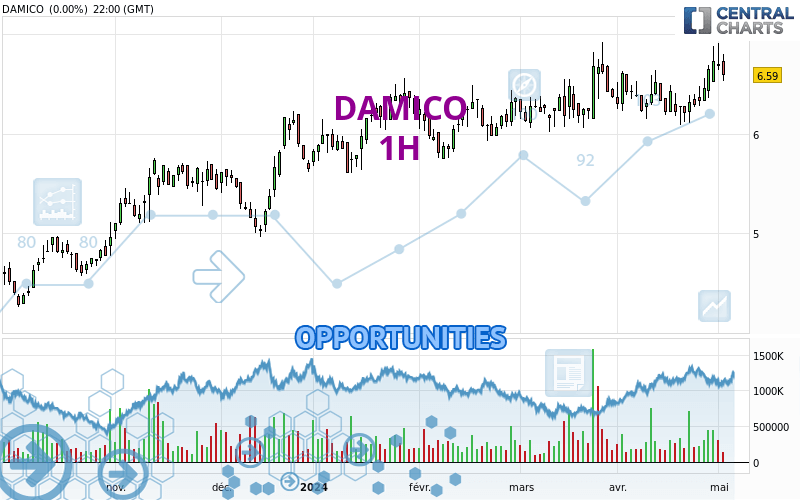
Londinia Opportunities Analyses - 05/06/2024 (GMT) DAMICO - 1H
-
EUR
(-)
-
15 min delayed data - Italy Stocks
| Type: | Stocks |
| Ticker: | DIS |
| ISIN: | LU2592315662 |
I am delighted to see that my first price objective has been achieved. I hope you've taken advantage of it.
- Europe Stocks
- Timeframe : 1H
- - Analysis generated on
- Status : TARGET REACHED
Summary of the analysis
Trends
Short term:
Strongly bullish
Underlying:
Strongly bullish
Technical indicators
72%
17%
11%
My opinion
Bullish above 6.74 EUR
My targets
6.91 EUR (+1.47%)
7.19 EUR (+5.58%)
My analysis
All elements being clearly bullish, it would be possible for traders to trade only long positions (at the time of purchase) on DAMICO as long as the price remains well above 6.74 EUR. The buyers' bullish objective is set at 6.91 EUR. A bullish break in this resistance would boost the bullish momentum. The buyers could then target the resistance located at 7.19 EUR. If there is any crossing, the next objective would be the resistance located at 9.66 EUR. However, beware of bullish excesses that could lead to a possible short-term correction; but this possible correction would not be tradeable.
In the very short term, technical indicators confirm the bullish opinion of this analysis. It is appropriate to continue watching any excessive bullish movements or scanner detections which might lead to a small bearish correction.
Force
0
10
7.9

Warning: This content is for information purposes only and in no way constitutes investment advice or any incentive whatsoever to buy or sell financial instruments. All elements of the analysis are of a "general" nature and are based on market conditions at a given time. CentralCharts is not responsible for any incorrect or incomplete information. Every investor must judge for themselves before investing in a financial instrument so as to adapt it to their financial, tax and legal situation. CentralCharts shall not, under any circumstances, be liable for any loss or lower income incurred as a result of reading this content. Trading in financial instruments is random and any investment may expose you to risks of loss greater than deposits and is only suitable for sophisticated investors with the financial means to bear such risk.
Additional analysis
Quotes
The DAMICO price is 6.81 EUR. The price has increased by +3.34% since the last closing with the lowest point at 6.59 EUR and the highest point at 6.85 EUR. The deviation from the price is +3.34% for the low point and -0.58% for the high point.6.59
6.85
6.81
A study of price movements over other periods shows the following variations:
Near a new HIGH record (5 years)
Type : Bullish
Timeframe : Weekly
Near a new HIGH record (1 year)
Type : Bullish
Timeframe : Weekly
Near a new HIGH record (1st january)
Type : Bullish
Timeframe : Weekly
Near a new HIGH record (1 month)
Type : Bullish
Timeframe : Weekly
Technical
Technical analysis of DAMICO in 1H shows a strongly overall bullish trend. 92.86% of the signals given by moving averages are bullish. The overall trend is supported by the strong bullish signals from short-term moving averages. The Central Indicators market scanner is currently detecting several bullish signals that could impact this trend:
Bullish trend reversal : Moving Average 20
Type : Bullish
Timeframe : 1 hour
Bullish trend reversal : adaptative moving average 20
Type : Bullish
Timeframe : 1 hour
Technical indicators are strongly bullish, suggesting that the price increase should continue.
Other results related to technical indicators were also found by the Central Indicators scanner:
Pivot points : price is over resistance 1
Type : Neutral
Timeframe : 1 hour
Price is back over the pivot point
Type : Bullish
Timeframe : Weekly
The Central Patterns scanner, which studies chart patterns, resistances and supports, has identified this signal:
Near resistance of channel
Type : Bearish
Timeframe : 1 hour
The Central Candlesticks scanner, specialised in Japanese candlesticks, did not identify any signals.
ProTrendLines
S3
S2
S1
R1
R2
R3
Price
| S3 | S2 | S1 | Price | R1 | R2 | R3 | |
|---|---|---|---|---|---|---|---|
| ProTrendLines | 6.47 | 6.64 | 6.74 | 6.81 | 6.91 | 7.19 | 9.66 |
| Change (%) | -4.99% | -2.50% | -1.03% | - | +1.47% | +5.58% | +41.85% |
| Change | -0.34 | -0.17 | -0.07 | - | +0.10 | +0.38 | +2.85 |
| Level | Major | Minor | Intermediate | - | Intermediate | Minor | Intermediate |
Attention could also be paid to pivot points to set price objectives:
Daily
| Pivot points | S3 | S2 | S1 | PP | R1 | R2 | R3 |
|---|---|---|---|---|---|---|---|
| Standard | 6.21 | 6.37 | 6.48 | 6.64 | 6.75 | 6.91 | 7.02 |
| Camarilla | 6.52 | 6.54 | 6.57 | 6.59 | 6.62 | 6.64 | 6.66 |
| Woodie | 6.19 | 6.36 | 6.46 | 6.63 | 6.73 | 6.90 | 7.00 |
| Fibonacci | 6.37 | 6.47 | 6.54 | 6.64 | 6.74 | 6.81 | 6.91 |
Weekly
| Pivot points | S3 | S2 | S1 | PP | R1 | R2 | R3 |
|---|---|---|---|---|---|---|---|
| Standard | 5.78 | 6.07 | 6.33 | 6.62 | 6.88 | 7.17 | 7.43 |
| Camarilla | 6.44 | 6.49 | 6.54 | 6.59 | 6.64 | 6.69 | 6.74 |
| Woodie | 5.77 | 6.06 | 6.32 | 6.61 | 6.87 | 7.16 | 7.42 |
| Fibonacci | 6.07 | 6.28 | 6.41 | 6.62 | 6.83 | 6.96 | 7.17 |
Monthly
| Pivot points | S3 | S2 | S1 | PP | R1 | R2 | R3 |
|---|---|---|---|---|---|---|---|
| Standard | 5.15 | 5.52 | 6.13 | 6.50 | 7.11 | 7.48 | 8.09 |
| Camarilla | 6.46 | 6.55 | 6.64 | 6.73 | 6.82 | 6.91 | 7.00 |
| Woodie | 5.26 | 5.58 | 6.24 | 6.56 | 7.22 | 7.54 | 8.20 |
| Fibonacci | 5.52 | 5.90 | 6.13 | 6.50 | 6.88 | 7.11 | 7.48 |
Numerical data
The following is the status of technical indicators and moving averages registered at the time this technical analysis was created:
Technical indicators
Moving averages
| RSI (14): | 61.38 | |
| MACD (12,26,9): | 0.0200 | |
| Directional Movement: | 12.27 | |
| AROON (14): | -64.29 | |
| DEMA (21): | 6.73 | |
| Parabolic SAR (0,02-0,02-0,2): | 6.54 | |
| Elder Ray (13): | 0.12 | |
| Super Trend (3,10): | 6.55 | |
| Zig ZAG (10): | 6.82 | |
| VORTEX (21): | 1.0200 | |
| Stochastique (14,3,5): | 57.89 | |
| TEMA (21): | 6.68 | |
| Williams %R (14): | -23.68 | |
| Chande Momentum Oscillator (20): | 0.05 | |
| Repulse (5,40,3): | 3.1800 | |
| ROCnROLL: | 1 | |
| TRIX (15,9): | 0.0500 | |
| Courbe Coppock: | 2.78 |
| MA7: | 6.55 | |
| MA20: | 6.27 | |
| MA50: | 6.18 | |
| MA100: | 5.97 | |
| MAexp7: | 6.71 | |
| MAexp20: | 6.70 | |
| MAexp50: | 6.59 | |
| MAexp100: | 6.45 | |
| Price / MA7: | +3.97% | |
| Price / MA20: | +8.61% | |
| Price / MA50: | +10.19% | |
| Price / MA100: | +14.07% | |
| Price / MAexp7: | +1.49% | |
| Price / MAexp20: | +1.64% | |
| Price / MAexp50: | +3.34% | |
| Price / MAexp100: | +5.58% |
Quotes :
-
15 min delayed data
-
Actions Italie
News
Don't forget to follow the news on DAMICO. At the time of publication of this analysis, the latest news was as follows:
- CTFN Expands Market-Leading News Service with Addition of Esther D'Amico
- Nexstar Media Inc. Promotes Donna D’Amico to Vice President and General Manager of Its Media Operations in Colorado Springs, Colorado
- Neudata Hires Donald D'Amico to Build Out Data Compliance Offering
- Trulieve Announces the Appointment of Alex D'Amico as Chief Financial Officer
- Code Dx CEO Anita D’Amico Featured in Women Know Cyber Book