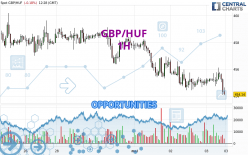
Londinia Opportunities Analyses - 05/03/2024 (GMT) GBP/HUF - 1H
I am pleased to note that the threshold for invalidation has been maintained for 20 Candlesticks.
- FX/Indices
- Timeframe : 1H
- - Analysis generated on
- Status : LEVEL MAINTAINED
Summary of the analysis
Trends
Short term:
Strongly bearish
Underlying:
Strongly bearish
Technical indicators
11%
67%
22%
My opinion
Bearish under 455.42 HUF
My targets
452.02 HUF (-2.13)
446.48 HUF (-7.67)
My analysis
All elements being clearly bearish, it would be possible for traders to trade only short positions (for sale) on GBP/HUF as long as the price remains well below 455.42 HUF. The sellers' bearish objective is set at 452.02 HUF. A bearish break of this support would revive the bearish momentum. The sellers could then target the support located at 446.48 HUF. In case of crossing, the next objective would be the support located at 441.48 HUF. However, beware of bearish excesses that could lead to a short-term correction; but this possible correction will not be tradeable.
Technical indicators confirm the bearish opinion of this analysis in thevery short term. However, be careful of excessive bearish movements. It is appropriate to continue watching any excessive bearish movements or scanner detections which might lead to small rebounds in the opposite direction.
Force
0
10
7.9

Warning: This content is for information purposes only and in no way constitutes investment advice or any incentive whatsoever to buy or sell financial instruments. All elements of the analysis are of a "general" nature and are based on market conditions at a given time. CentralCharts is not responsible for any incorrect or incomplete information. Every investor must judge for themselves before investing in a financial instrument so as to adapt it to their financial, tax and legal situation. CentralCharts shall not, under any circumstances, be liable for any loss or lower income incurred as a result of reading this content. Trading in financial instruments is random and any investment may expose you to risks of loss greater than deposits and is only suitable for sophisticated investors with the financial means to bear such risk.
Additional analysis
Quotes
GBP/HUF rating 454.15 HUF. The price registered a decrease of -0.17% on the session with the lowest point at 454.08 HUF and the highest point at 456.13 HUF. The deviation from the price is +0.02% for the low point and -0.43% for the high point.454.08
456.13
454.15
The Central Gaps scanner detects a bullish opening marking the presence of buyers ahead of sellers at the opening but not sufficiently marked to allow the price to register a quotation gap.
Bullish opening
Type : Bullish
Timeframe : Openning
So that you have an overall view of the price change, here is a table showing the variations over several periods:
Near a new HIGH record (1 year)
Type : Bullish
Timeframe : Weekly
Near a new LOW record (1st january)
Type : Bearish
Timeframe : Weekly
Near a new HIGH record (1 month)
Type : Bullish
Timeframe : Weekly
Technical
Technical analysis of this 1H chart of GBP/HUF indicates that the overall trend is strongly bearish. 92.86% of the signals given by moving averages are bearish. This strongly bearish trend is supported by the strong bearish signals given by short-term moving averages. An assessment of moving averages reveals a bearish signal that could impact this trend:
Bearish trend reversal : Moving Average 20
Type : Bearish
Timeframe : 1 hour
In fact, 12 technical indicators on 18 studied are currently bearish. But beware of excesses. The Central Indicators scanner currently detects this:
CCI indicator is oversold : under -100
Type : Neutral
Timeframe : 1 hour
Previous candle closed under Bollinger bands
Type : Neutral
Timeframe : 1 hour
Pivot points : price is under support 1
Type : Neutral
Timeframe : Weekly
MACD crosses DOWN its Moving Average
Type : Bearish
Timeframe : 1 hour
Central Patterns, the scanner specializing in chart patterns, did not identify any signals.
There is also a Japanese candlestick pattern detected by Central Candlesticks that could mark the end of the current short-term trend:
Doji
Type : Neutral
Timeframe : 1 hour
ProTrendLines
S3
S2
S1
R1
R2
R3
Price
| S3 | S2 | S1 | Price | R1 | R2 | R3 | |
|---|---|---|---|---|---|---|---|
| ProTrendLines | 430.85 | 441.48 | 446.48 | 454.15 | 454.43 | 455.42 | 456.62 |
| Change (%) | -5.13% | -2.79% | -1.69% | - | +0.06% | +0.28% | +0.54% |
| Change | -23.30 | -12.67 | -7.67 | - | +0.28 | +1.27 | +2.47 |
| Level | Major | Intermediate | Major | - | Intermediate | Minor | Major |
Attention could also be paid to pivot points to set price objectives:
Daily
| Pivot points | S3 | S2 | S1 | PP | R1 | R2 | R3 |
|---|---|---|---|---|---|---|---|
| Standard | 451.70 | 453.07 | 454.00 | 455.37 | 456.30 | 457.67 | 458.60 |
| Camarilla | 454.31 | 454.52 | 454.73 | 454.94 | 455.15 | 455.36 | 455.57 |
| Woodie | 451.49 | 452.96 | 453.79 | 455.26 | 456.09 | 457.56 | 458.39 |
| Fibonacci | 453.07 | 453.95 | 454.49 | 455.37 | 456.25 | 456.79 | 457.67 |
Weekly
| Pivot points | S3 | S2 | S1 | PP | R1 | R2 | R3 |
|---|---|---|---|---|---|---|---|
| Standard | 452.02 | 453.97 | 456.30 | 458.25 | 460.58 | 462.53 | 464.86 |
| Camarilla | 457.46 | 457.86 | 458.25 | 458.64 | 459.03 | 459.43 | 459.82 |
| Woodie | 452.22 | 454.07 | 456.50 | 458.35 | 460.78 | 462.63 | 465.06 |
| Fibonacci | 453.97 | 455.60 | 456.61 | 458.25 | 459.88 | 460.89 | 462.53 |
Monthly
| Pivot points | S3 | S2 | S1 | PP | R1 | R2 | R3 |
|---|---|---|---|---|---|---|---|
| Standard | 441.28 | 446.94 | 452.33 | 457.99 | 463.38 | 469.04 | 474.43 |
| Camarilla | 454.69 | 455.70 | 456.72 | 457.73 | 458.74 | 459.76 | 460.77 |
| Woodie | 441.16 | 446.87 | 452.21 | 457.92 | 463.26 | 468.97 | 474.31 |
| Fibonacci | 446.94 | 451.16 | 453.77 | 457.99 | 462.21 | 464.82 | 469.04 |
Numerical data
The following is the status of technical indicators and moving averages registered at the time this technical analysis was created:
Technical indicators
Moving averages
| RSI (14): | 36.16 | |
| MACD (12,26,9): | -0.1700 | |
| Directional Movement: | -6.57 | |
| AROON (14): | -21.43 | |
| DEMA (21): | 454.88 | |
| Parabolic SAR (0,02-0,02-0,2): | 456.09 | |
| Elder Ray (13): | -0.67 | |
| Super Trend (3,10): | 456.23 | |
| Zig ZAG (10): | 454.30 | |
| VORTEX (21): | 0.9600 | |
| Stochastique (14,3,5): | 21.86 | |
| TEMA (21): | 454.98 | |
| Williams %R (14): | -85.85 | |
| Chande Momentum Oscillator (20): | -0.87 | |
| Repulse (5,40,3): | -0.1900 | |
| ROCnROLL: | 2 | |
| TRIX (15,9): | 0.0000 | |
| Courbe Coppock: | 0.02 |
| MA7: | 457.02 | |
| MA20: | 457.80 | |
| MA50: | 459.62 | |
| MA100: | 453.49 | |
| MAexp7: | 454.92 | |
| MAexp20: | 455.11 | |
| MAexp50: | 455.60 | |
| MAexp100: | 456.33 | |
| Price / MA7: | -0.63% | |
| Price / MA20: | -0.80% | |
| Price / MA50: | -1.19% | |
| Price / MA100: | +0.15% | |
| Price / MAexp7: | -0.17% | |
| Price / MAexp20: | -0.21% | |
| Price / MAexp50: | -0.32% | |
| Price / MAexp100: | -0.48% |
Quotes :
-
Real time data
-
Forex