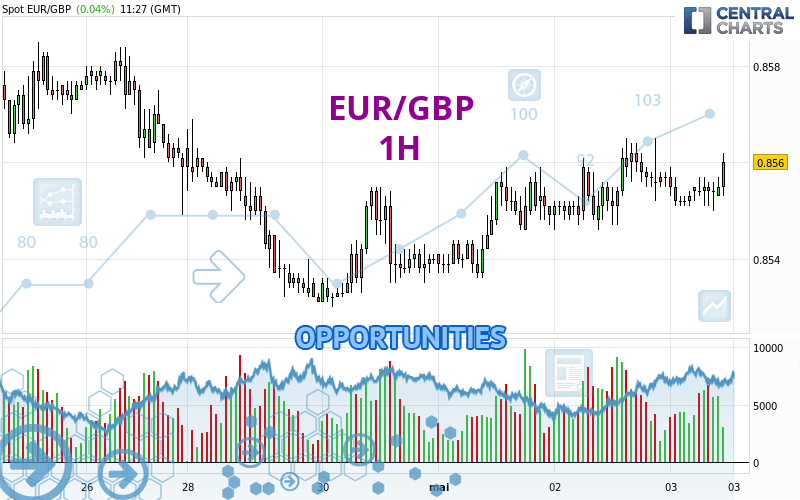
Londinia Opportunities Analyses - 05/03/2024 (GMT) EUR/GBP - 1H
- FX/Indices
- Timeframe : 1H
- - Analysis generated on
- Status : LEVEL MAINTAINED
Summary of the analysis

Additional analysis
Quotes
The EUR/GBP rating is 0.8560 GBP. The price registered an increase of +0.04% on the session with the lowest point at 0.8550 GBP and the highest point at 0.8562 GBP. The deviation from the price is +0.12% for the low point and -0.02% for the high point.So that you have an overall view of the price change, here is a table showing the variations over several periods:
Near a new LOW record (5 years)
Type : Bearish
Timeframe : Weekly
Near a new HIGH record (1 year)
Type : Bullish
Timeframe : Weekly
Near a new HIGH record (1st january)
Type : Bullish
Timeframe : Weekly
Near a new HIGH record (1 month)
Type : Bullish
Timeframe : Weekly
Technical
A technical analysis in 1H of this EUR/GBP chart shows a strongly bullish trend. 89.29% of the signals given by moving averages are bullish. The overall trend is supported by the strong bullish signals from short-term moving averages. An assessment of moving averages reveals several bullish signals that could impact this trend:
Bullish trend reversal : adaptative moving average 20
Type : Bullish
Timeframe : 1 hour
Bullish trend reversal : adaptative moving average 100
Type : Bullish
Timeframe : 1 hour
Bullish price crossover with Moving Average 20
Type : Bullish
Timeframe : 1 hour
In fact, 13 technical indicators on 18 studied are currently positioned bullish. Central Indicators, the detector scanner for these technical indicators has recently detected several signals:
MACD crosses UP its Moving Average
Type : Bullish
Timeframe : 1 hour
Price is back over the pivot point
Type : Bullish
Timeframe : 1 hour
Momentum indicator is back over 0
Type : Bullish
Timeframe : 1 hour
Williams %R indicator is back over -50
Type : Bullish
Timeframe : 1 hour
The Central Patterns scanner, which studies chart patterns, resistances and supports, has identified these signals:
Near horizontal support
Type : Bullish
Timeframe : 1 hour
Support of channel is broken
Type : Bearish
Timeframe : 1 hour
No result was found by the Central Candlesticks scanner on Japanese candlesticks.
| S3 | S2 | S1 | Price | R1 | R2 | R3 | |
|---|---|---|---|---|---|---|---|
| ProTrendLines | 0.8511 | 0.8536 | 0.8546 | 0.8560 | 0.8562 | 0.8592 | 0.8627 |
| Change (%) | -0.57% | -0.28% | -0.16% | - | +0.02% | +0.37% | +0.78% |
| Change | -0.0049 | -0.0024 | -0.0014 | - | +0.0002 | +0.0032 | +0.0067 |
| Level | Major | Intermediate | Intermediate | - | Major | Intermediate | Major |
To determine price objectives, it is also possible to use the pivot points. Here is the price position in relation to pivot points:
| Pivot points | S3 | S2 | S1 | PP | R1 | R2 | R3 |
|---|---|---|---|---|---|---|---|
| Standard | 0.8528 | 0.8537 | 0.8547 | 0.8556 | 0.8566 | 0.8575 | 0.8585 |
| Camarilla | 0.8552 | 0.8554 | 0.8555 | 0.8557 | 0.8559 | 0.8561 | 0.8562 |
| Woodie | 0.8529 | 0.8537 | 0.8548 | 0.8556 | 0.8567 | 0.8575 | 0.8586 |
| Fibonacci | 0.8537 | 0.8544 | 0.8549 | 0.8556 | 0.8563 | 0.8568 | 0.8575 |
| Pivot points | S3 | S2 | S1 | PP | R1 | R2 | R3 |
|---|---|---|---|---|---|---|---|
| Standard | 0.8428 | 0.8488 | 0.8524 | 0.8584 | 0.8620 | 0.8680 | 0.8716 |
| Camarilla | 0.8533 | 0.8541 | 0.8550 | 0.8559 | 0.8568 | 0.8577 | 0.8585 |
| Woodie | 0.8415 | 0.8482 | 0.8511 | 0.8578 | 0.8607 | 0.8674 | 0.8703 |
| Fibonacci | 0.8488 | 0.8525 | 0.8548 | 0.8584 | 0.8621 | 0.8644 | 0.8680 |
| Pivot points | S3 | S2 | S1 | PP | R1 | R2 | R3 |
|---|---|---|---|---|---|---|---|
| Standard | 0.8368 | 0.8445 | 0.8492 | 0.8569 | 0.8616 | 0.8693 | 0.8740 |
| Camarilla | 0.8506 | 0.8517 | 0.8529 | 0.8540 | 0.8551 | 0.8563 | 0.8574 |
| Woodie | 0.8354 | 0.8438 | 0.8478 | 0.8562 | 0.8602 | 0.8686 | 0.8726 |
| Fibonacci | 0.8445 | 0.8492 | 0.8521 | 0.8569 | 0.8616 | 0.8645 | 0.8693 |
Numerical data
The following is the status of technical indicators and moving averages registered at the time this technical analysis was created:
| RSI (14): | 63.21 | |
| MACD (12,26,9): | 0.0001 | |
| Directional Movement: | 8.8661 | |
| AROON (14): | -85.7143 | |
| DEMA (21): | 0.8556 | |
| Parabolic SAR (0,02-0,02-0,2): | 0.8562 | |
| Elder Ray (13): | 0.0002 | |
| Super Trend (3,10): | 0.8541 | |
| Zig ZAG (10): | 0.8561 | |
| VORTEX (21): | 1.0000 | |
| Stochastique (14,3,5): | 50.30 | |
| TEMA (21): | 0.8555 | |
| Williams %R (14): | -9.09 | |
| Chande Momentum Oscillator (20): | 0.0003 | |
| Repulse (5,40,3): | 0.1077 | |
| ROCnROLL: | 1 | |
| TRIX (15,9): | 0.0010 | |
| Courbe Coppock: | 0.04 |
| MA7: | 0.8553 | |
| MA20: | 0.8565 | |
| MA50: | 0.8559 | |
| MA100: | 0.8571 | |
| MAexp7: | 0.8556 | |
| MAexp20: | 0.8555 | |
| MAexp50: | 0.8553 | |
| MAexp100: | 0.8554 | |
| Price / MA7: | +0.08% | |
| Price / MA20: | -0.06% | |
| Price / MA50: | +0.01% | |
| Price / MA100: | -0.13% | |
| Price / MAexp7: | +0.05% | |
| Price / MAexp20: | +0.06% | |
| Price / MAexp50: | +0.08% | |
| Price / MAexp100: | +0.07% |
News
The latest news and videos published on EUR/GBP at the time of the analysis were as follows:
-
 EUR/GBP Forecast May 1, 2024
-
EUR/GBP Forecast April 25, 2024
-
Weekly Technical Outlook: 08/04/2024 - USDJPY, EURGBP, USDCAD
-
EUR/GBP Forecast April 2, 2024
-
EUR/GBP Forecast March 29, 2024