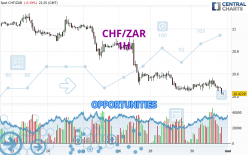
Londinia Opportunities Analyses - 04/30/2024 (GMT) CHF/ZAR - 1H
- FX/Indices
- Timeframe : 1H
- - Analysis generated on
- Status : TARGET REACHED
Summary of the analysis

Additional analysis
Quotes
The CHF/ZAR rating is 20.4193 ZAR. On the day, this instrument lost -0.21% and was traded between 20.4104 ZAR and 20.5648 ZAR over the period. The price is currently at +0.04% from its lowest and -0.71% from its highest.The Central Gaps scanner detects a bullish opening. A small advantage for buyers in the very short term.
Bullish opening
Type : Bullish
Timeframe : Openning
A study of price movements over other periods shows the following variations:
Near a new LOW record (1 year)
Type : Bearish
Timeframe : Weekly
Near a new LOW record (1st january)
Type : Bearish
Timeframe : Weekly
Near a new HIGH record (1 month)
Type : Bullish
Timeframe : Weekly
Technical
A technical analysis in 1H of this CHF/ZAR chart shows a sharp bearish trend. The signals given by moving averages are 92.86% bearish. This strong bearish trend is confirmed by the strong signals currently being given by short-term moving averages. An assessment of moving averages reveals a bearish signal that could impact this trend:
Bearish trend reversal : Moving Average 20
Type : Bearish
Timeframe : 1 hour
Technical indicators are strongly bearish, suggesting that the price decline is expected to continue.
Caution: the Central Indicators scanner currently detects an excess:
CCI indicator is oversold : under -100
Type : Neutral
Timeframe : 1 hour
Previous candle closed under Bollinger bands
Type : Neutral
Timeframe : 1 hour
Williams %R indicator is oversold : under -80
Type : Neutral
Timeframe : 1 hour
An analysis of the price chart with the Central Patterns scanner (detector of chart patterns and resistances and supports) shows several results that can have an impact on the price change:
Near horizontal resistance
Type : Bearish
Timeframe : 1 hour
Resistance of channel is broken
Type : Bullish
Timeframe : 1 hour
There is also a Japanese candlestick pattern detected by Central Candlesticks that could mark the end of the current short-term trend:
Doji
Type : Neutral
Timeframe : 1 hour
| S3 | S2 | S1 | Price | R1 | R2 | R3 | |
|---|---|---|---|---|---|---|---|
| ProTrendLines | 17.6291 | 19.3389 | 20.3256 | 20.4193 | 20.4511 | 20.5911 | 20.9128 |
| Change (%) | -13.66% | -5.29% | -0.46% | - | +0.16% | +0.84% | +2.42% |
| Change | -2.7902 | -1.0804 | -0.0937 | - | +0.0318 | +0.1718 | +0.4935 |
| Level | Intermediate | Minor | Major | - | Intermediate | Intermediate | Intermediate |
To determine price objectives, it is also possible to use the pivot points. Here is the price position in relation to pivot points:
| Pivot points | S3 | S2 | S1 | PP | R1 | R2 | R3 |
|---|---|---|---|---|---|---|---|
| Standard | 20.2064 | 20.3229 | 20.3925 | 20.5090 | 20.5786 | 20.6951 | 20.7647 |
| Camarilla | 20.4108 | 20.4279 | 20.4449 | 20.4620 | 20.4791 | 20.4961 | 20.5132 |
| Woodie | 20.1829 | 20.3112 | 20.3690 | 20.4973 | 20.5551 | 20.6834 | 20.7412 |
| Fibonacci | 20.3229 | 20.3940 | 20.4379 | 20.5090 | 20.5801 | 20.6240 | 20.6951 |
| Pivot points | S3 | S2 | S1 | PP | R1 | R2 | R3 |
|---|---|---|---|---|---|---|---|
| Standard | 19.6698 | 20.0840 | 20.3110 | 20.7252 | 20.9522 | 21.3664 | 21.5934 |
| Camarilla | 20.3617 | 20.4205 | 20.4792 | 20.5380 | 20.5968 | 20.6556 | 20.7143 |
| Woodie | 19.5762 | 20.0372 | 20.2174 | 20.6784 | 20.8586 | 21.3196 | 21.4998 |
| Fibonacci | 20.0840 | 20.3289 | 20.4803 | 20.7252 | 20.9701 | 21.1215 | 21.3664 |
| Pivot points | S3 | S2 | S1 | PP | R1 | R2 | R3 |
|---|---|---|---|---|---|---|---|
| Standard | 19.6777 | 20.2544 | 20.5806 | 21.1573 | 21.4835 | 22.0602 | 22.3864 |
| Camarilla | 20.6584 | 20.7412 | 20.8239 | 20.9067 | 20.9895 | 21.0722 | 21.1550 |
| Woodie | 19.5524 | 20.1918 | 20.4553 | 21.0947 | 21.3582 | 21.9976 | 22.2611 |
| Fibonacci | 20.2544 | 20.5993 | 20.8124 | 21.1573 | 21.5022 | 21.7153 | 22.0602 |
Numerical data
The following are the details of the technical indicators and moving averages that were collected to generate this technical analysis:
| RSI (14): | 34.35 | |
| MACD (12,26,9): | -0.0183 | |
| Directional Movement: | -14.5596 | |
| AROON (14): | -50.0000 | |
| DEMA (21): | 20.4623 | |
| Parabolic SAR (0,02-0,02-0,2): | 20.5351 | |
| Elder Ray (13): | -0.0537 | |
| Super Trend (3,10): | 20.5511 | |
| Zig ZAG (10): | 20.4186 | |
| VORTEX (21): | 0.9549 | |
| Stochastique (14,3,5): | 15.65 | |
| TEMA (21): | 20.4703 | |
| Williams %R (14): | -88.99 | |
| Chande Momentum Oscillator (20): | -0.0778 | |
| Repulse (5,40,3): | -0.1234 | |
| ROCnROLL: | 2 | |
| TRIX (15,9): | -0.0064 | |
| Courbe Coppock: | 0.28 |
| MA7: | 20.7582 | |
| MA20: | 20.7386 | |
| MA50: | 21.0868 | |
| MA100: | 21.4037 | |
| MAexp7: | 20.4618 | |
| MAexp20: | 20.4866 | |
| MAexp50: | 20.5383 | |
| MAexp100: | 20.6374 | |
| Price / MA7: | -1.63% | |
| Price / MA20: | -1.54% | |
| Price / MA50: | -3.17% | |
| Price / MA100: | -4.60% | |
| Price / MAexp7: | -0.21% | |
| Price / MAexp20: | -0.33% | |
| Price / MAexp50: | -0.58% | |
| Price / MAexp100: | -1.06% |