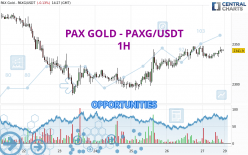
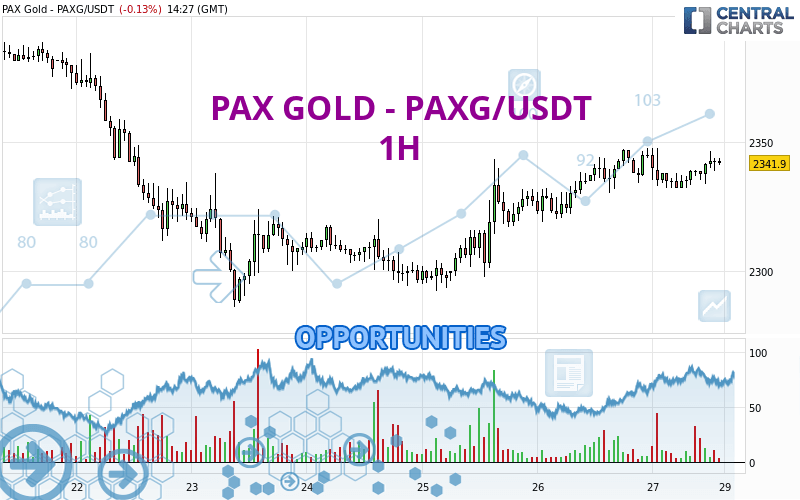
Londinia Opportunities Analyses - 04/27/2024 (GMT) PAX GOLD - PAXG/USDT - 1H
| Type: | Cryptocurrencies |
| Ticker: | PAXGUSDT |
| ISIN: |
I am delighted to see that my first price objective has been achieved. I hope you've taken advantage of it.
- Cryptocurrencies
- Timeframe : 1H
- - Analysis generated on
- Status : TARGET REACHED
Summary of the analysis
Trends
Short term:
Bullish
Underlying:
Strongly bullish
Technical indicators
72%
11%
17%
My opinion
Bullish above 2,319.02 USDT
My targets
2,380.01 USDT (+1.59%)
2,408.67 USDT (+2.81%)
My analysis
The basic bullish trend is very strong on PAX GOLD - PAXG/USDT but the short term shows some signs of running out of steam. However, a purchase could be considered as long as the price remains above 2,319.02 USDT. Crossing the first resistance at 2,380.01 USDT would be a sign of a potential new surge in the price. Buyers would then use the next resistance located at 2,408.67 USDT as an objective. Crossing it would then enable buyers to target 2,449.85 USDT. Caution, a return to below 2,319.02 USDT would be a sign of a consolidation phase in the short-term basic trend. If this is the case, remember that trading against the trend may be riskier. It would seem more appropriate to wait for a signal indicating reversal of the trend.
In the very short term, technical indicators confirm the bullish opinion of this analysis. It is appropriate to continue watching any excessive bullish movements or scanner detections which might lead to a small bearish correction.
Force
0
10
7.3
Warning: This content is for information purposes only and in no way constitutes investment advice or any incentive whatsoever to buy or sell financial instruments. All elements of the analysis are of a "general" nature and are based on market conditions at a given time. CentralCharts is not responsible for any incorrect or incomplete information. Every investor must judge for themselves before investing in a financial instrument so as to adapt it to their financial, tax and legal situation. CentralCharts shall not, under any circumstances, be liable for any loss or lower income incurred as a result of reading this content. Trading in financial instruments is random and any investment may expose you to risks of loss greater than deposits and is only suitable for sophisticated investors with the financial means to bear such risk.
Additional analysis
Quotes
The PAX GOLD - PAXG/USDT price is 2,342.85 USDT. The price registered a decrease of -0.09% on the session with the lowest point at 2,332.01 USDT and the highest point at 2,347.88 USDT. The deviation from the price is +0.46% for the low point and -0.21% for the high point.2,332.01
2,347.88
2,342.85
Here is a more detailed summary of the historical variations registered by PAX GOLD - PAXG/USDT:
Abnormal volumes
Timeframe : 20 days
Abnormal volumes
Timeframe : 50 days
Technical
A technical analysis in 1H of this PAX GOLD - PAXG/USDT chart shows a strongly bullish trend. The signals given by moving averages are 89.29% bullish. This strongly bullish trend seems to be running out of steam given the signals being given by short-term moving averages. The Central Indicators market scanner currently does not detect any result that concerns moving averages.
In fact, according to the parameters integrated into the Central Analyzer system, 13 technical indicators out of 18 analysed are currently bullish. The Central Indicators scanner specialised in technical indicators, has not detected anything further.
The Central Patterns scanner, which studies chart patterns, resistances and supports, has identified these signals:
Near horizontal resistance
Type : Bearish
Timeframe : 1 hour
Near resistance of channel
Type : Bearish
Timeframe : 1 hour
The Central Candlesticks scanner, specialised in Japanese candlesticks, did not identify any signals.
ProTrendLines
S3
S2
S1
R1
R2
R3
Price
| S3 | S2 | S1 | Price | R1 | R2 | R3 | |
|---|---|---|---|---|---|---|---|
| ProTrendLines | 2,184.16 | 2,292.44 | 2,319.02 | 2,342.85 | 2,343.59 | 2,380.01 | 2,408.67 |
| Change (%) | -6.77% | -2.15% | -1.02% | - | +0.03% | +1.59% | +2.81% |
| Change | -158.69 | -50.41 | -23.83 | - | +0.74 | +37.16 | +65.82 |
| Level | Minor | Minor | Intermediate | - | Intermediate | Major | Minor |
Pivot points can also be used to set your price objectives. Here is the price situation in relation to pivot points:
Daily
| Pivot points | S3 | S2 | S1 | PP | R1 | R2 | R3 |
|---|---|---|---|---|---|---|---|
| Standard | 2,297.91 | 2,308.49 | 2,326.70 | 2,337.28 | 2,355.49 | 2,366.07 | 2,384.28 |
| Camarilla | 2,336.98 | 2,339.62 | 2,342.26 | 2,344.90 | 2,347.54 | 2,350.18 | 2,352.82 |
| Woodie | 2,301.72 | 2,310.40 | 2,330.51 | 2,339.19 | 2,359.30 | 2,367.98 | 2,388.09 |
| Fibonacci | 2,308.49 | 2,319.49 | 2,326.29 | 2,337.28 | 2,348.28 | 2,355.08 | 2,366.07 |
Weekly
| Pivot points | S3 | S2 | S1 | PP | R1 | R2 | R3 |
|---|---|---|---|---|---|---|---|
| Standard | 2,103.41 | 2,219.90 | 2,304.67 | 2,421.16 | 2,505.93 | 2,622.42 | 2,707.19 |
| Camarilla | 2,334.10 | 2,352.55 | 2,371.00 | 2,389.45 | 2,407.90 | 2,426.35 | 2,444.80 |
| Woodie | 2,087.56 | 2,211.97 | 2,288.82 | 2,413.23 | 2,490.08 | 2,614.49 | 2,691.34 |
| Fibonacci | 2,219.90 | 2,296.78 | 2,344.28 | 2,421.16 | 2,498.04 | 2,545.54 | 2,622.42 |
Monthly
| Pivot points | S3 | S2 | S1 | PP | R1 | R2 | R3 |
|---|---|---|---|---|---|---|---|
| Standard | 2,036.75 | 2,073.77 | 2,147.79 | 2,184.81 | 2,258.83 | 2,295.85 | 2,369.87 |
| Camarilla | 2,191.28 | 2,201.46 | 2,211.64 | 2,221.82 | 2,232.00 | 2,242.18 | 2,252.36 |
| Woodie | 2,055.26 | 2,083.02 | 2,166.30 | 2,194.06 | 2,277.34 | 2,305.10 | 2,388.38 |
| Fibonacci | 2,073.77 | 2,116.18 | 2,142.39 | 2,184.81 | 2,227.22 | 2,253.43 | 2,295.85 |
Numerical data
The following is the status of technical indicators and moving averages registered at the time this technical analysis was created:
Technical indicators
Moving averages
| RSI (14): | 59.30 | |
| MACD (12,26,9): | 2.1600 | |
| Directional Movement: | 4.89 | |
| AROON (14): | -28.57 | |
| DEMA (21): | 2,342.00 | |
| Parabolic SAR (0,02-0,02-0,2): | 2,333.33 | |
| Elder Ray (13): | 3.35 | |
| Super Trend (3,10): | 2,326.98 | |
| Zig ZAG (10): | 2,343.69 | |
| VORTEX (21): | 1.0200 | |
| Stochastique (14,3,5): | 69.92 | |
| TEMA (21): | 2,340.79 | |
| Williams %R (14): | -25.17 | |
| Chande Momentum Oscillator (20): | 5.82 | |
| Repulse (5,40,3): | 0.2300 | |
| ROCnROLL: | 1 | |
| TRIX (15,9): | 0.0100 | |
| Courbe Coppock: | 0.01 |
| MA7: | 2,331.43 | |
| MA20: | 2,362.64 | |
| MA50: | 2,258.63 | |
| MA100: | 2,137.43 | |
| MAexp7: | 2,341.11 | |
| MAexp20: | 2,338.74 | |
| MAexp50: | 2,333.15 | |
| MAexp100: | 2,331.67 | |
| Price / MA7: | +0.49% | |
| Price / MA20: | -0.84% | |
| Price / MA50: | +3.73% | |
| Price / MA100: | +9.61% | |
| Price / MAexp7: | +0.07% | |
| Price / MAexp20: | +0.18% | |
| Price / MAexp50: | +0.42% | |
| Price / MAexp100: | +0.48% |
Quotes :
-
Real time data
-
Cryptocompare