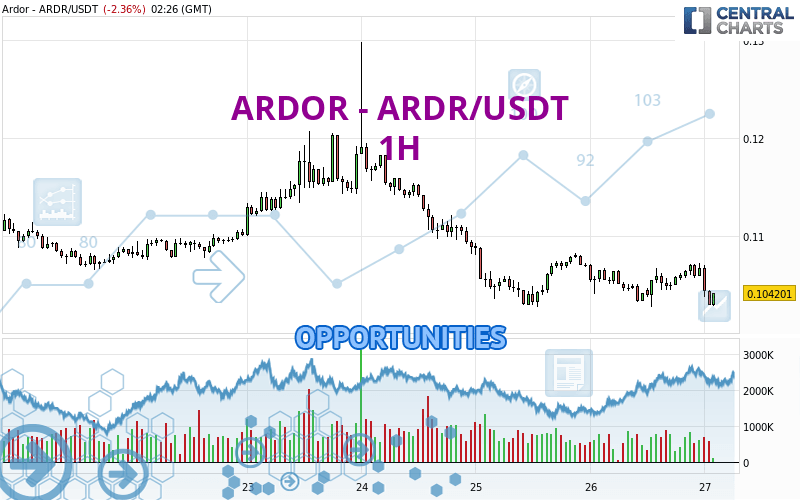
Londinia Opportunities Analyses - 04/27/2024 (GMT) ARDOR - ARDR/USDT - 1H
| Type: | Cryptocurrencies |
| Ticker: | ARDRUSDT |
| ISIN: |
- Cryptocurrencies
- Timeframe : 1H
- - Analysis generated on
- Status : INVALID
Summary of the analysis
Trends
Short term:
Strongly bearish
Underlying:
Strongly bearish
Technical indicators
17%
72%
11%
My opinion
Bearish under 0.105702 USDT
My targets
0.099181 USDT (-4.63%)
0.095895 USDT (-7.79%)
My analysis
ARDOR - ARDR/USDT is part of a very strong bearish trend. Traders may consider trading only short positions (for sale) as long as the price remains well below 0.105702 USDT. The next support located at 0.099181 USDT is the next bearish objective to target. A bearish break of this support would revive the bearish momentum. The bearish movement could then continue towards the next support located at 0.095895 USDT. Below this support, sellers could then target 0.089011 USDT. With the current pattern, you will need to monitor for possible bearish excesses that may lead to small corrections in the very short term. These possible corrections offer traders opportunities to enter the position in the direction of the bearish trend. Trying to profit from the purchase of these possible corrections may seem risky.
Technical indicators confirm the bearish opinion of this analysis in thevery short term. However, be careful of excessive bearish movements. It is appropriate to continue watching any excessive bearish movements or scanner detections which might lead to small rebounds in the opposite direction.
Force
0
10
7.9

Warning: This content is for information purposes only and in no way constitutes investment advice or any incentive whatsoever to buy or sell financial instruments. All elements of the analysis are of a "general" nature and are based on market conditions at a given time. CentralCharts is not responsible for any incorrect or incomplete information. Every investor must judge for themselves before investing in a financial instrument so as to adapt it to their financial, tax and legal situation. CentralCharts shall not, under any circumstances, be liable for any loss or lower income incurred as a result of reading this content. Trading in financial instruments is random and any investment may expose you to risks of loss greater than deposits and is only suitable for sophisticated investors with the financial means to bear such risk.
Additional analysis
Quotes
The ARDOR - ARDR/USDT rating is 0.103991 USDT. On the day, this instrument lost -2.56% and was traded between 0.102885 USDT and 0.107051 USDT over the period. The price is currently at +1.07% from its lowest and -2.86% from its highest.0.102885
0.107051
0.103991
A bearish opening was detected by the Central Gaps scanner. Sellers are trying to impose a bearish trend in the very short term.
Bearish opening
Type : Bearish
Timeframe : Openning
So that you have an overall view of the price change, here is a table showing the variations over several periods:
Technical
A technical analysis in 1H of this ARDOR - ARDR/USDT chart shows a sharp bearish trend. 92.86% of the signals given by moving averages are bearish. The overall trend is supported by the strong bearish signals from short-term moving averages. There is no crossing of moving average by the price or crossing of moving averages between themselves.
In fact, 13 technical indicators on 18 studied are currently bearish. But beware of excesses. The Central Indicators scanner currently detects this:
CCI indicator is oversold : under -100
Type : Neutral
Timeframe : 1 hour
Williams %R indicator is oversold : under -80
Type : Neutral
Timeframe : 1 hour
Pivot points : price is under support 1
Type : Neutral
Timeframe : 1 hour
Price is back under the pivot point
Type : Bearish
Timeframe : Weekly
Central Patterns, the scanner specializing in chart patterns, did not identify any signals.
The Central Candlesticks scanner, specialised in Japanese candlesticks, did not identify any signals.
ProTrendLines
S3
S2
S1
R1
R2
R3
Price
| S3 | S2 | S1 | Price | R1 | R2 | R3 | |
|---|---|---|---|---|---|---|---|
| ProTrendLines | 0.080596 | 0.089011 | 0.095895 | 0.103991 | 0.104184 | 0.112215 | 0.120684 |
| Change (%) | -22.50% | -14.41% | -7.79% | - | +0.19% | +7.91% | +16.05% |
| Change | -0.023395 | -0.014980 | -0.008096 | - | +0.000193 | +0.008224 | +0.016693 |
| Level | Major | Minor | Major | - | Major | Intermediate | Minor |
Pivot points can also be used to set your price objectives. Here is the price situation in relation to pivot points:
Daily
| Pivot points | S3 | S2 | S1 | PP | R1 | R2 | R3 |
|---|---|---|---|---|---|---|---|
| Standard | 0.099492 | 0.101152 | 0.103936 | 0.105596 | 0.108380 | 0.110040 | 0.112824 |
| Camarilla | 0.105497 | 0.105904 | 0.106312 | 0.106719 | 0.107126 | 0.107534 | 0.107941 |
| Woodie | 0.100053 | 0.101433 | 0.104497 | 0.105877 | 0.108941 | 0.110321 | 0.113385 |
| Fibonacci | 0.101152 | 0.102850 | 0.103899 | 0.105596 | 0.107294 | 0.108343 | 0.110040 |
Weekly
| Pivot points | S3 | S2 | S1 | PP | R1 | R2 | R3 |
|---|---|---|---|---|---|---|---|
| Standard | 0.081334 | 0.087855 | 0.099181 | 0.105702 | 0.117028 | 0.123549 | 0.134875 |
| Camarilla | 0.105600 | 0.107236 | 0.108872 | 0.110508 | 0.112144 | 0.113780 | 0.115416 |
| Woodie | 0.083738 | 0.089056 | 0.101585 | 0.106903 | 0.119432 | 0.124750 | 0.137279 |
| Fibonacci | 0.087855 | 0.094672 | 0.098884 | 0.105702 | 0.112519 | 0.116731 | 0.123549 |
Monthly
| Pivot points | S3 | S2 | S1 | PP | R1 | R2 | R3 |
|---|---|---|---|---|---|---|---|
| Standard | 0.044630 | 0.071549 | 0.105119 | 0.132038 | 0.165608 | 0.192527 | 0.226097 |
| Camarilla | 0.122055 | 0.127599 | 0.133144 | 0.138689 | 0.144234 | 0.149779 | 0.155324 |
| Woodie | 0.047956 | 0.073212 | 0.108445 | 0.133701 | 0.168934 | 0.194190 | 0.229423 |
| Fibonacci | 0.071549 | 0.094656 | 0.108931 | 0.132038 | 0.155145 | 0.169420 | 0.192527 |
Numerical data
The following is the status of technical indicators and moving averages registered at the time this technical analysis was created:
Technical indicators
Moving averages
| RSI (14): | 37.82 | |
| MACD (12,26,9): | -0.0005 | |
| Directional Movement: | -13.162824 | |
| AROON (14): | 71.428572 | |
| DEMA (21): | 0.104655 | |
| Parabolic SAR (0,02-0,02-0,2): | 0.107171 | |
| Elder Ray (13): | -0.001919 | |
| Super Trend (3,10): | 0.106909 | |
| Zig ZAG (10): | 0.103053 | |
| VORTEX (21): | 0.9197 | |
| Stochastique (14,3,5): | 15.27 | |
| TEMA (21): | 0.104742 | |
| Williams %R (14): | -98.38 | |
| Chande Momentum Oscillator (20): | -0.003036 | |
| Repulse (5,40,3): | -2.5533 | |
| ROCnROLL: | 2 | |
| TRIX (15,9): | -0.0310 | |
| Courbe Coppock: | 0.43 |
| MA7: | 0.108942 | |
| MA20: | 0.110481 | |
| MA50: | 0.119609 | |
| MA100: | 0.106795 | |
| MAexp7: | 0.104551 | |
| MAexp20: | 0.105424 | |
| MAexp50: | 0.106354 | |
| MAexp100: | 0.107570 | |
| Price / MA7: | -4.54% | |
| Price / MA20: | -5.87% | |
| Price / MA50: | -13.06% | |
| Price / MA100: | -2.63% | |
| Price / MAexp7: | -0.54% | |
| Price / MAexp20: | -1.36% | |
| Price / MAexp50: | -2.22% | |
| Price / MAexp100: | -3.33% |
Quotes :
-
Real time data
-
Cryptocompare