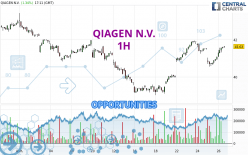
Londinia Opportunities Analyses - 04/26/2024 (GMT) QIAGEN N.V. - 1H
-
USD
(-)
-
15 min delayed data - NYSE Stocks
| Type: | Stocks |
| Ticker: | QGEN |
| ISIN: | NL0000240000 |
I am delighted to see that my first price objective has been achieved. I hope you've taken advantage of it.
- U.S. Stocks
- Timeframe : 1H
- - Analysis generated on
- Status : TARGET REACHED
Summary of the analysis
Trends
Short term:
Bullish
Underlying:
Strongly bullish
Technical indicators
72%
6%
22%
My opinion
Bullish above 41.32 USD
My targets
42.18 USD (+1.32%)
43.42 USD (+4.30%)
My analysis
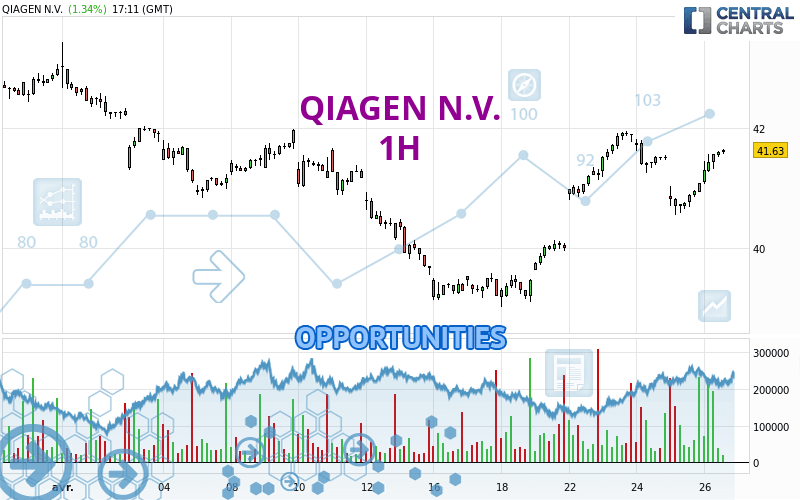
The basic bullish trend is very strong on QIAGEN N.V. but the short term shows some signs of running out of steam. However, a purchase could be considered as long as the price remains above 41.32 USD. Crossing the first resistance at 42.18 USD would be a sign of a potential new surge in the price. Buyers would then use the next resistance located at 43.42 USD as an objective. Crossing it would then enable buyers to target 44.36 USD. Caution, a return to below 41.32 USD would be a sign of a consolidation phase in the short-term basic trend. If this is the case, remember that trading against the trend may be riskier. It would seem more appropriate to wait for a signal indicating reversal of the trend.
Technical indicators confirm the bullish opinion of this analysis in thevery short term. However, be careful of excessive bullish movements. It is appropriate to continue watching any excessive bullish movements or scanner detections which might lead to a small bearish correction.
Force
0
10
7.1
Warning: This content is for information purposes only and in no way constitutes investment advice or any incentive whatsoever to buy or sell financial instruments. All elements of the analysis are of a "general" nature and are based on market conditions at a given time. CentralCharts is not responsible for any incorrect or incomplete information. Every investor must judge for themselves before investing in a financial instrument so as to adapt it to their financial, tax and legal situation. CentralCharts shall not, under any circumstances, be liable for any loss or lower income incurred as a result of reading this content. Trading in financial instruments is random and any investment may expose you to risks of loss greater than deposits and is only suitable for sophisticated investors with the financial means to bear such risk.
Additional analysis
Quotes
The QIAGEN N.V. price is 41.63 USD. The price registered an increase of +1.34% on the session and was traded between 41.06 USD and 41.63 USD over the period. The price is currently at +1.39% from its lowest and 0% from its highest.41.06
41.63
41.63
The Central Gaps scanner detects a bullish gap which is a sign that buyers have taken the lead in the very short term.
Opening Gap UP
Type : Bullish
Timeframe : Openning
Here is a more detailed summary of the historical variations registered by QIAGEN N.V.:
Near a new LOW record (1st january)
Type : Bearish
Timeframe : Weekly
Near a new LOW record (1 month)
Type : Bearish
Timeframe : Weekly
Technical
Technical analysis of QIAGEN N.V. in 1H shows a strongly overall bullish trend. 85.71% of the signals given by moving averages are bullish. The slightly bullish signals given by the short-term moving averages indicate this trend is showing signs of running out of steam. An assessment of moving averages reveals a bullish signal that could impact this trend:
Moving Average bullish crossovers : MA50 & MA100
Type : Bullish
Timeframe : 1 hour
In fact, 13 technical indicators on 18 studied are currently bullish. Caution: the Central Indicators scanner currently detects an excess:
Williams %R indicator is overbought : over -20
Type : Neutral
Timeframe : 1 hour
Pivot points : price is over resistance 2
Type : Neutral
Timeframe : 1 hour
Pivot points : price is over resistance 2
Type : Neutral
Timeframe : Weekly
MACD crosses UP its Moving Average
Type : Bullish
Timeframe : 1 hour
No signals are given by Central Patterns, a market scanner specialised in chart patterns, resistances and supports.
The Central Candlesticks scanner which studies Japanese candlesticks did not detect anything.
ProTrendLines
S3
S2
S1
R1
R2
R3
Price
| S3 | S2 | S1 | Price | R1 | R2 | R3 | |
|---|---|---|---|---|---|---|---|
| ProTrendLines | 40.36 | 40.84 | 41.32 | 41.63 | 42.18 | 43.42 | 44.36 |
| Change (%) | -3.05% | -1.90% | -0.74% | - | +1.32% | +4.30% | +6.56% |
| Change | -1.27 | -0.79 | -0.31 | - | +0.55 | +1.79 | +2.73 |
| Level | Minor | Intermediate | Minor | - | Major | Minor | Minor |
Pivot points can also be used to set your price objectives. Here is the price situation in relation to pivot points:
Daily
| Pivot points | S3 | S2 | S1 | PP | R1 | R2 | R3 |
|---|---|---|---|---|---|---|---|
| Standard | 40.20 | 40.38 | 40.73 | 40.91 | 41.26 | 41.44 | 41.79 |
| Camarilla | 40.93 | 40.98 | 41.03 | 41.08 | 41.13 | 41.18 | 41.23 |
| Woodie | 40.29 | 40.42 | 40.82 | 40.95 | 41.35 | 41.48 | 41.88 |
| Fibonacci | 40.38 | 40.58 | 40.71 | 40.91 | 41.11 | 41.24 | 41.44 |
Weekly
| Pivot points | S3 | S2 | S1 | PP | R1 | R2 | R3 |
|---|---|---|---|---|---|---|---|
| Standard | 37.74 | 38.39 | 39.19 | 39.84 | 40.64 | 41.29 | 42.09 |
| Camarilla | 39.60 | 39.73 | 39.87 | 40.00 | 40.13 | 40.27 | 40.40 |
| Woodie | 37.83 | 38.43 | 39.28 | 39.88 | 40.73 | 41.33 | 42.18 |
| Fibonacci | 38.39 | 38.94 | 39.28 | 39.84 | 40.39 | 40.73 | 41.29 |
Monthly
| Pivot points | S3 | S2 | S1 | PP | R1 | R2 | R3 |
|---|---|---|---|---|---|---|---|
| Standard | 38.70 | 40.39 | 41.69 | 43.38 | 44.68 | 46.37 | 47.67 |
| Camarilla | 42.17 | 42.44 | 42.72 | 42.99 | 43.26 | 43.54 | 43.81 |
| Woodie | 38.51 | 40.29 | 41.50 | 43.28 | 44.49 | 46.27 | 47.48 |
| Fibonacci | 40.39 | 41.53 | 42.24 | 43.38 | 44.52 | 45.23 | 46.37 |
Numerical data
The following is the status of technical indicators and moving averages registered at the time this technical analysis was created:
Technical indicators
Moving averages
| RSI (14): | 63.14 | |
| MACD (12,26,9): | 0.1200 | |
| Directional Movement: | 11.66 | |
| AROON (14): | 64.29 | |
| DEMA (21): | 41.40 | |
| Parabolic SAR (0,02-0,02-0,2): | 40.67 | |
| Elder Ray (13): | 0.30 | |
| Super Trend (3,10): | 40.91 | |
| Zig ZAG (10): | 41.59 | |
| VORTEX (21): | 1.0300 | |
| Stochastique (14,3,5): | 95.05 | |
| TEMA (21): | 41.31 | |
| Williams %R (14): | -0.95 | |
| Chande Momentum Oscillator (20): | 0.09 | |
| Repulse (5,40,3): | 1.0500 | |
| ROCnROLL: | 1 | |
| TRIX (15,9): | 0.0400 | |
| Courbe Coppock: | 1.50 |
| MA7: | 40.97 | |
| MA20: | 40.99 | |
| MA50: | 42.58 | |
| MA100: | 43.56 | |
| MAexp7: | 41.41 | |
| MAexp20: | 41.22 | |
| MAexp50: | 40.95 | |
| MAexp100: | 41.02 | |
| Price / MA7: | +1.61% | |
| Price / MA20: | +1.56% | |
| Price / MA50: | -2.23% | |
| Price / MA100: | -4.43% | |
| Price / MAexp7: | +0.51% | |
| Price / MAexp20: | +0.97% | |
| Price / MAexp50: | +1.64% | |
| Price / MAexp100: | +1.46% |
Quotes :
-
15 min delayed data
-
Actions NYSE
News
The latest news and videos published on QIAGEN N.V. at the time of the analysis were as follows:
- QIAGEN Announces Form 20-F Annual Report Filing for 2022 Results
- QIAGEN and Servier Partner to Develop Companion Diagnostic for Acute Myeloid Leukemia (AML) Therapy Drug
- QIAGEN and SOPHiA GENETICS Forge Partnership to Combine Strengths in Next-Generation Sequencing
- QIAGEN’s tuberculosis blood test QuantiFERON-TB Gold Plus gains CE-marking under new EU IVDR framework
- QIAGEN Exceeds Outlook for Fourth Quarter and Full-Year 2022 With 14% CER Sales Growth in FY 2022 From Non-COVID Product Groups