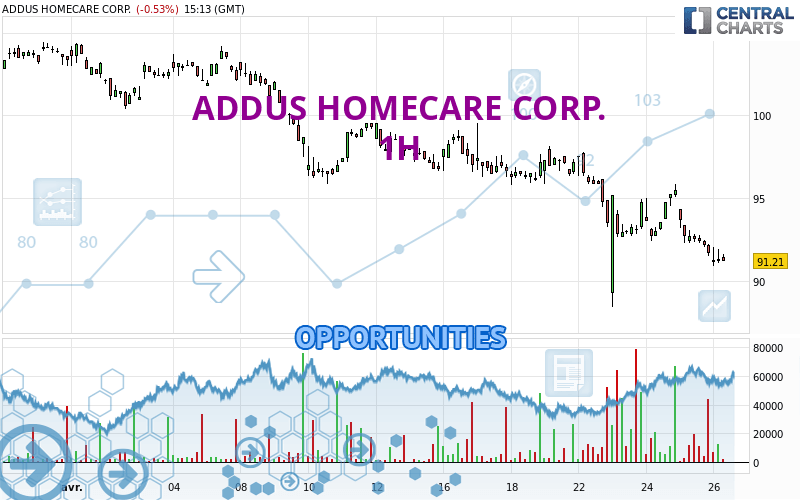
Londinia Opportunities Analyses - 04/26/2024 (GMT) ADDUS HOMECARE CORP. - 1H
- U.S. Stocks
- Timeframe : 1H
- - Analysis generated on
- Status : INVALID
Summary of the analysis
Trends
Short term:
Strongly bearish
Underlying:
Strongly bearish
Technical indicators
6%
78%
17%
My opinion
Bearish under 93.78 USD
My targets
88.41 USD (-3.39%)
86.59 USD (-5.38%)
My analysis
The bearish trend is currently very strong for ADDUS HOMECARE CORP.. As long as the price remains below the resistance at 93.78 USD, you could try to take advantage of the bearish rally. The first bearish objective is located at 88.41 USD. The bearish momentum would be revived by a break in this support. Sellers would then use the next support located at 86.59 USD as an objective. Crossing it would then enable sellers to target 82.99 USD. Be careful, given the powerful bearish rally underway, excesses could lead to a short-term rebound. If this is the case, remember that trading against the trend may be riskier. It would seem more appropriate to wait for a signal indicating reversal of the trend.
In the very short term, the general bearish sentiment is confirmed by technical indicators. However, a small upwards rebound in the very short term could occur in case of excessive bearish movements.
Force
0
10
8.4

Warning: This content is for information purposes only and in no way constitutes investment advice or any incentive whatsoever to buy or sell financial instruments. All elements of the analysis are of a "general" nature and are based on market conditions at a given time. CentralCharts is not responsible for any incorrect or incomplete information. Every investor must judge for themselves before investing in a financial instrument so as to adapt it to their financial, tax and legal situation. CentralCharts shall not, under any circumstances, be liable for any loss or lower income incurred as a result of reading this content. Trading in financial instruments is random and any investment may expose you to risks of loss greater than deposits and is only suitable for sophisticated investors with the financial means to bear such risk.
Additional analysis
Quotes
ADDUS HOMECARE CORP. rating 91.51 USD. The price registered a decrease of -0.21% on the session with the lowest point at 90.90 USD and the highest point at 92.01 USD. The deviation from the price is +0.67% for the low point and -0.54% for the high point.90.90
92.01
91.51
The Central Gaps scanner detects the formation of a bearish gap marking the strong presence of sellers ahead of buyers at the opening. This formed a quotation gap.
Opening Gap DOWN
Type : Bearish
Timeframe : Openning
So that you have an overall view of the price change, here is a table showing the variations over several periods:
Near a new LOW record (1 month)
Type : Bearish
Timeframe : Weekly
Technical
Technical analysis of ADDUS HOMECARE CORP. in 1H shows a overall strongly bearish trend. The signals given by moving averages are 92.86% bearish. This strong bearish trend is confirmed by the strong signals currently being given by short-term moving averages. The Central Indicators market scanner currently does not detect any result that concerns moving averages.
Technical indicators are strongly bearish, suggesting that the price decline is expected to continue.
Caution: the Central Indicators scanner currently detects an excess:
CCI indicator is oversold : under -100
Type : Neutral
Timeframe : 1 hour
Williams %R indicator is oversold : under -80
Type : Neutral
Timeframe : 1 hour
Pivot points : price is under support 3
Type : Neutral
Timeframe : Weekly
Central Patterns, the scanner specializing in chart patterns, did not identify any signals.
No result was found by the Central Candlesticks scanner on Japanese candlesticks.
ProTrendLines
S3
S2
S1
R1
R2
R3
Price
| S3 | S2 | S1 | Price | R1 | R2 | R3 | |
|---|---|---|---|---|---|---|---|
| ProTrendLines | 86.59 | 88.41 | 91.49 | 91.51 | 96.30 | 100.38 | 101.66 |
| Change (%) | -5.38% | -3.39% | -0.02% | - | +5.23% | +9.69% | +11.09% |
| Change | -4.92 | -3.10 | -0.02 | - | +4.79 | +8.87 | +10.15 |
| Level | Major | Intermediate | Intermediate | - | Major | Minor | Minor |
Pivot points can also be used to set your price objectives. Here is the price situation in relation to pivot points:
Daily
| Pivot points | S3 | S2 | S1 | PP | R1 | R2 | R3 |
|---|---|---|---|---|---|---|---|
| Standard | 87.89 | 89.70 | 90.70 | 92.51 | 93.51 | 95.32 | 96.32 |
| Camarilla | 90.93 | 91.19 | 91.44 | 91.70 | 91.96 | 92.22 | 92.47 |
| Woodie | 87.49 | 89.50 | 90.30 | 92.31 | 93.11 | 95.12 | 95.92 |
| Fibonacci | 89.70 | 90.77 | 91.44 | 92.51 | 93.58 | 94.25 | 95.32 |
Weekly
| Pivot points | S3 | S2 | S1 | PP | R1 | R2 | R3 |
|---|---|---|---|---|---|---|---|
| Standard | 91.77 | 93.78 | 95.49 | 97.50 | 99.21 | 101.22 | 102.93 |
| Camarilla | 96.17 | 96.51 | 96.85 | 97.19 | 97.53 | 97.87 | 98.21 |
| Woodie | 91.61 | 93.71 | 95.33 | 97.43 | 99.05 | 101.15 | 102.77 |
| Fibonacci | 93.78 | 95.20 | 96.08 | 97.50 | 98.92 | 99.80 | 101.22 |
Monthly
| Pivot points | S3 | S2 | S1 | PP | R1 | R2 | R3 |
|---|---|---|---|---|---|---|---|
| Standard | 82.78 | 87.40 | 95.37 | 99.99 | 107.96 | 112.58 | 120.55 |
| Camarilla | 99.88 | 101.03 | 102.19 | 103.34 | 104.49 | 105.65 | 106.80 |
| Woodie | 84.46 | 88.24 | 97.05 | 100.83 | 109.64 | 113.42 | 122.23 |
| Fibonacci | 87.40 | 92.21 | 95.18 | 99.99 | 104.80 | 107.77 | 112.58 |
Numerical data
The following is the status of technical indicators and moving averages registered at the time this technical analysis was created:
Technical indicators
Moving averages
| RSI (14): | 34.76 | |
| MACD (12,26,9): | -0.9800 | |
| Directional Movement: | -19.71 | |
| AROON (14): | -57.15 | |
| DEMA (21): | 91.84 | |
| Parabolic SAR (0,02-0,02-0,2): | 95.33 | |
| Elder Ray (13): | -1.10 | |
| Super Trend (3,10): | 94.39 | |
| Zig ZAG (10): | 91.31 | |
| VORTEX (21): | 0.9200 | |
| Stochastique (14,3,5): | 5.69 | |
| TEMA (21): | 91.57 | |
| Williams %R (14): | -91.73 | |
| Chande Momentum Oscillator (20): | -2.26 | |
| Repulse (5,40,3): | -0.9900 | |
| ROCnROLL: | 2 | |
| TRIX (15,9): | -0.1200 | |
| Courbe Coppock: | 3.19 |
| MA7: | 94.44 | |
| MA20: | 97.86 | |
| MA50: | 97.44 | |
| MA100: | 94.42 | |
| MAexp7: | 91.98 | |
| MAexp20: | 93.08 | |
| MAexp50: | 94.69 | |
| MAexp100: | 96.42 | |
| Price / MA7: | -3.10% | |
| Price / MA20: | -6.49% | |
| Price / MA50: | -6.09% | |
| Price / MA100: | -3.08% | |
| Price / MAexp7: | -0.51% | |
| Price / MAexp20: | -1.69% | |
| Price / MAexp50: | -3.36% | |
| Price / MAexp100: | -5.09% |
Quotes :
-
15 min delayed data
-
Actions NASDAQ
News
The last news published on ADDUS HOMECARE CORP. at the time of the generation of this analysis was as follows:
- Addus HomeCare Completes Acquisition of Tennessee Quality Care Operations
- Addus HomeCare Announces Second Quarter 2023 Financial Results
- Addus HomeCare Announces Second Quarter 2023 Earnings Release and Conference Call
- Addus HomeCare Expands Tennessee Home Care Presence With Agreement to Acquire Tennessee Quality Care Operations
- Addus HomeCare to Participate in the 2023 Jefferies Healthcare Conference