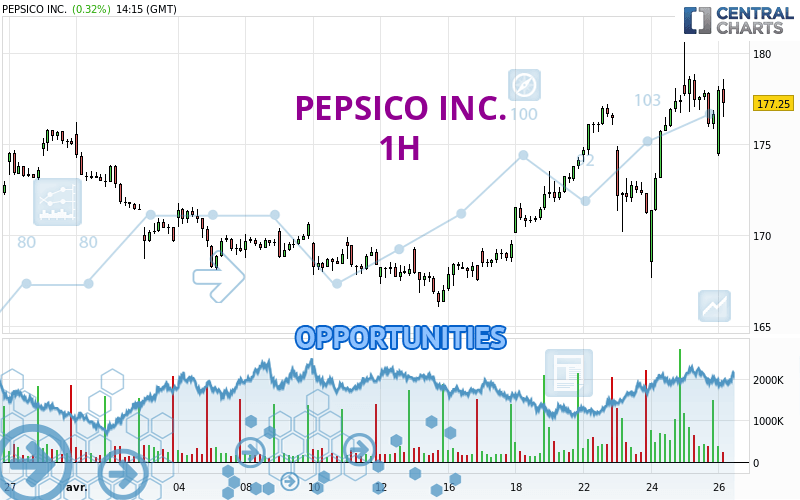
Londinia Opportunities Analyses - 04/26/2024 (GMT) PEPSICO INC. - 1H
- U.S. Stocks
- Timeframe : 1H
- - Analysis generated on
- Status : INVALID
Summary of the analysis
Trends
Short term:
Strongly bullish
Underlying:
Strongly bullish
Technical indicators
67%
0%
33%
My opinion
Bullish above 177.20 USD
My targets
179.16 USD (+0.59%)
180.63 USD (+1.41%)
My analysis
All elements being clearly bullish, it would be possible for traders to trade only long positions (at the time of purchase) on PEPSICO INC. as long as the price remains well above 177.20 USD. The buyers' bullish objective is set at 179.16 USD. A bullish break in this resistance would boost the bullish momentum. The buyers could then target the resistance located at 180.63 USD. If there is any crossing, the next objective would be the resistance located at 184.06 USD. However, beware of bullish excesses that could lead to a possible short-term correction; but this possible correction would not be tradeable.
Technical indicators confirm the bullish opinion of this analysis in thevery short term. However, be careful of excessive bullish movements. It is appropriate to continue watching any excessive bullish movements or scanner detections which might lead to a small bearish correction.
Force
0
10
8.2

Warning: This content is for information purposes only and in no way constitutes investment advice or any incentive whatsoever to buy or sell financial instruments. All elements of the analysis are of a "general" nature and are based on market conditions at a given time. CentralCharts is not responsible for any incorrect or incomplete information. Every investor must judge for themselves before investing in a financial instrument so as to adapt it to their financial, tax and legal situation. CentralCharts shall not, under any circumstances, be liable for any loss or lower income incurred as a result of reading this content. Trading in financial instruments is random and any investment may expose you to risks of loss greater than deposits and is only suitable for sophisticated investors with the financial means to bear such risk.
Additional analysis
Quotes
The PEPSICO INC. price is 178.11 USD. The price has increased by +0.81% since the last closing with the lowest point at 174.34 USD and the highest point at 178.57 USD. The deviation from the price is +2.16% for the low point and -0.26% for the high point.174.34
178.57
178.11
The Central Gaps scanner detects a bearish gap which is a sign that the sellers have taken the lead in the very short term.
Opening Gap DOWN
Type : Bearish
Timeframe : Openning
A study of price movements over other periods shows the following variations:
New HIGH record (1st january)
Type : Bullish
Timeframe : Weekly
New HIGH record (1 month)
Type : Bullish
Timeframe : Weekly
Technical
A technical analysis in 1H of this PEPSICO INC. chart shows a strongly bullish trend. The signals given by the moving averages are 92.86% bullish. This strong bullish trend is confirmed by the strong signals currently being given by short-term moving averages. The Central Indicators scanner does not detect any result on moving averages that would impact this trend.
The probability of a further increase are moderate given the direction of the technical indicators.
Central Indicators, the scanner specialised in technical indicators, has identified these signals:
Pivot points : price is over resistance 1
Type : Neutral
Timeframe : Weekly
MACD crosses UP its Moving Average
Type : Bullish
Timeframe : 1 hour
Parabolic SAR indicator bearish reversal
Type : Bearish
Timeframe : 1 hour
Price is back over the pivot point
Type : Bullish
Timeframe : 1 hour
Central Patterns, the scanner specializing in chart patterns, did not identify any signals.
The Central Candlesticks scanner which studies Japanese candlesticks did not detect anything.
ProTrendLines
S3
S2
S1
R1
R2
R3
Price
| S3 | S2 | S1 | Price | R1 | R2 | R3 | |
|---|---|---|---|---|---|---|---|
| ProTrendLines | 172.28 | 175.01 | 177.20 | 178.11 | 179.16 | 180.63 | 184.06 |
| Change (%) | -3.27% | -1.74% | -0.51% | - | +0.59% | +1.41% | +3.34% |
| Change | -5.83 | -3.10 | -0.91 | - | +1.05 | +2.52 | +5.95 |
| Level | Major | Minor | Major | - | Intermediate | Minor | Minor |
Pivot points can also be used to set your price objectives. Here is the price situation in relation to pivot points:
Daily
| Pivot points | S3 | S2 | S1 | PP | R1 | R2 | R3 |
|---|---|---|---|---|---|---|---|
| Standard | 169.98 | 172.90 | 174.79 | 177.71 | 179.60 | 182.52 | 184.41 |
| Camarilla | 175.36 | 175.80 | 176.24 | 176.68 | 177.12 | 177.56 | 178.00 |
| Woodie | 169.47 | 172.64 | 174.28 | 177.45 | 179.09 | 182.26 | 183.90 |
| Fibonacci | 172.90 | 174.74 | 175.87 | 177.71 | 179.55 | 180.68 | 182.52 |
Weekly
| Pivot points | S3 | S2 | S1 | PP | R1 | R2 | R3 |
|---|---|---|---|---|---|---|---|
| Standard | 160.44 | 163.24 | 168.68 | 171.48 | 176.92 | 179.72 | 185.16 |
| Camarilla | 171.86 | 172.62 | 173.38 | 174.13 | 174.89 | 175.64 | 176.40 |
| Woodie | 161.77 | 163.90 | 170.01 | 172.14 | 178.25 | 180.38 | 186.49 |
| Fibonacci | 163.24 | 166.38 | 168.33 | 171.48 | 174.62 | 176.57 | 179.72 |
Monthly
| Pivot points | S3 | S2 | S1 | PP | R1 | R2 | R3 |
|---|---|---|---|---|---|---|---|
| Standard | 151.94 | 156.88 | 165.94 | 170.88 | 179.94 | 184.88 | 193.94 |
| Camarilla | 171.16 | 172.44 | 173.73 | 175.01 | 176.29 | 177.58 | 178.86 |
| Woodie | 154.01 | 157.91 | 168.01 | 171.91 | 182.01 | 185.91 | 196.01 |
| Fibonacci | 156.88 | 162.23 | 165.53 | 170.88 | 176.23 | 179.53 | 184.88 |
Numerical data
The following is the status of the technical indicators and moving averages at the time of publication of this technical analysis:
Technical indicators
Moving averages
| RSI (14): | 62.57 | |
| MACD (12,26,9): | 1.2100 | |
| Directional Movement: | -2.28 | |
| AROON (14): | 50.00 | |
| DEMA (21): | 177.66 | |
| Parabolic SAR (0,02-0,02-0,2): | 180.63 | |
| Elder Ray (13): | -0.45 | |
| Super Trend (3,10): | 174.33 | |
| Zig ZAG (10): | 178.05 | |
| VORTEX (21): | 1.0800 | |
| Stochastique (14,3,5): | 68.66 | |
| TEMA (21): | 177.87 | |
| Williams %R (14): | -26.69 | |
| Chande Momentum Oscillator (20): | 2.31 | |
| Repulse (5,40,3): | 2.4700 | |
| ROCnROLL: | 1 | |
| TRIX (15,9): | 0.1000 | |
| Courbe Coppock: | 5.24 |
| MA7: | 175.21 | |
| MA20: | 171.42 | |
| MA50: | 169.07 | |
| MA100: | 168.18 | |
| MAexp7: | 177.50 | |
| MAexp20: | 176.08 | |
| MAexp50: | 174.02 | |
| MAexp100: | 172.34 | |
| Price / MA7: | +1.66% | |
| Price / MA20: | +3.90% | |
| Price / MA50: | +5.35% | |
| Price / MA100: | +5.90% | |
| Price / MAexp7: | +0.34% | |
| Price / MAexp20: | +1.15% | |
| Price / MAexp50: | +2.35% | |
| Price / MAexp100: | +3.35% |
Quotes :
-
15 min delayed data
-
Actions NASDAQ
News
The last news published on PEPSICO INC. at the time of the generation of this analysis was as follows:
- PepsiCo, Inc. Announces Pre Stabilisation Notice
- Enjoy Infinite Hydration In Style with New Drinkfinity Bottle
- PepsiCo, Inc Announces Pre Stabilisation Notice
- Families, Invent Away! Frito-Lay Announces Return of "Dreamvention" to Find the Next Best Invention Idea
-
 Tesla Shares Pop After Pepsi Places Order For Electric Semi Trucks | CNBC