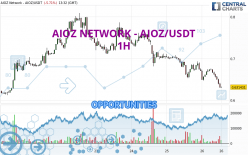
Londinia Opportunities Analyses - 04/26/2024 (GMT) AIOZ NETWORK - AIOZ/USDT - 1H
| Type: | Cryptocurrencies |
| Ticker: | AIOZUSDT |
| ISIN: |
I am delighted to see that my first price objective has been achieved. I hope you've taken advantage of it.
- Cryptocurrencies
- Timeframe : 1H
- - Analysis generated on
- Status : TARGET REACHED
Summary of the analysis
Trends
Short term:
Strongly bearish
Underlying:
Strongly bearish
Technical indicators
11%
78%
11%
My opinion
Bearish under 0.659282 USDT
My targets
0.602241 USDT (-4.80%)
0.562961 USDT (-11.01%)
My analysis
All elements being clearly bearish, it would be possible for traders to trade only short positions (for sale) on AIOZ NETWORK - AIOZ/USDT as long as the price remains well below 0.659282 USDT. The sellers' bearish objective is set at 0.602241 USDT. A bearish break of this support would revive the bearish momentum. The sellers could then target the support located at 0.562961 USDT. In case of crossing, the next objective would be the support located at 0.328991 USDT. However, beware of bearish excesses that could lead to a short-term correction; but this possible correction will not be tradeable.
In the very short term, the general bearish sentiment is confirmed by technical indicators. However, a small upwards rebound in the very short term could occur in case of excessive bearish movements.
Force
0
10
8.2

Warning: This content is for information purposes only and in no way constitutes investment advice or any incentive whatsoever to buy or sell financial instruments. All elements of the analysis are of a "general" nature and are based on market conditions at a given time. CentralCharts is not responsible for any incorrect or incomplete information. Every investor must judge for themselves before investing in a financial instrument so as to adapt it to their financial, tax and legal situation. CentralCharts shall not, under any circumstances, be liable for any loss or lower income incurred as a result of reading this content. Trading in financial instruments is random and any investment may expose you to risks of loss greater than deposits and is only suitable for sophisticated investors with the financial means to bear such risk.
Additional analysis
Quotes
The AIOZ NETWORK - AIOZ/USDT rating is 0.632607 USDT. The price registered a decrease of -5.53% on the session and was traded between 0.629814 USDT and 0.675750 USDT over the period. The price is currently at +0.44% from its lowest and -6.38% from its highest.0.629814
0.675750
0.632607
Here is a more detailed summary of the historical variations registered by AIOZ NETWORK - AIOZ/USDT:
Technical
Technical analysis of this 1H chart of AIOZ NETWORK - AIOZ/USDT indicates that the overall trend is strongly bearish. 92.86% of the signals given by moving averages are bearish. This strongly bearish trend is supported by the strong bearish signals given by short-term moving averages. The Central Indicators market scanner currently does not detect any result that concerns moving averages.
Technical indicators are strongly bearish, suggesting that the price decline is expected to continue.
Caution: the Central Indicators scanner currently detects an excess:
CCI indicator is oversold : under -100
Type : Neutral
Timeframe : 1 hour
Previous candle closed under Bollinger bands
Type : Neutral
Timeframe : 1 hour
Williams %R indicator is oversold : under -80
Type : Neutral
Timeframe : 1 hour
Pivot points : price is under support 1
Type : Neutral
Timeframe : 1 hour
Price is back under the pivot point
Type : Bearish
Timeframe : Weekly
No signals are given by Central Patterns, a market scanner specialised in chart patterns, resistances and supports.
The presence of these Japanese chandelier patterns detected by Central Candlesticks that could impact the current short-term trend were also noted:
White hanging man / hammer
Type : Neutral
Timeframe : 1 hour
Bullish doji star
Type : Bullish
Timeframe : 1 hour
ProTrendLines
S3
S2
S1
R1
R2
R3
Price
| S3 | S2 | S1 | Price | R1 | R2 | R3 | |
|---|---|---|---|---|---|---|---|
| ProTrendLines | 0.328991 | 0.562961 | 0.602241 | 0.632607 | 0.659282 | 0.680869 | 0.711245 |
| Change (%) | -47.99% | -11.01% | -4.80% | - | +4.22% | +7.63% | +12.43% |
| Change | -0.303616 | -0.069646 | -0.030366 | - | +0.026675 | +0.048262 | +0.078638 |
| Level | Minor | Minor | Major | - | Major | Minor | Intermediate |
Pivot points can also be used to set your price objectives. Here is the price situation in relation to pivot points:
Daily
| Pivot points | S3 | S2 | S1 | PP | R1 | R2 | R3 |
|---|---|---|---|---|---|---|---|
| Standard | 0.586579 | 0.619611 | 0.644628 | 0.677660 | 0.702677 | 0.735709 | 0.760726 |
| Camarilla | 0.653681 | 0.659002 | 0.664323 | 0.669644 | 0.674965 | 0.680286 | 0.685608 |
| Woodie | 0.582571 | 0.617607 | 0.640620 | 0.675656 | 0.698669 | 0.733705 | 0.756718 |
| Fibonacci | 0.619611 | 0.641786 | 0.655486 | 0.677660 | 0.699835 | 0.713535 | 0.735709 |
Weekly
| Pivot points | S3 | S2 | S1 | PP | R1 | R2 | R3 |
|---|---|---|---|---|---|---|---|
| Standard | 0.285920 | 0.412354 | 0.547766 | 0.674200 | 0.809612 | 0.936046 | 1.071458 |
| Camarilla | 0.611171 | 0.635174 | 0.659177 | 0.683179 | 0.707182 | 0.731184 | 0.755187 |
| Woodie | 0.290410 | 0.414599 | 0.552256 | 0.676445 | 0.814102 | 0.938291 | 1.075948 |
| Fibonacci | 0.412354 | 0.512379 | 0.574175 | 0.674200 | 0.774225 | 0.836021 | 0.936046 |
Monthly
| Pivot points | S3 | S2 | S1 | PP | R1 | R2 | R3 |
|---|---|---|---|---|---|---|---|
| Standard | -0.129169 | 0.130566 | 0.535914 | 0.795649 | 1.200997 | 1.460732 | 1.866080 |
| Camarilla | 0.758365 | 0.819331 | 0.880297 | 0.941263 | 1.002229 | 1.063195 | 1.124161 |
| Woodie | -0.056362 | 0.166969 | 0.608722 | 0.832052 | 1.273805 | 1.497135 | 1.938888 |
| Fibonacci | 0.130566 | 0.384627 | 0.541587 | 0.795649 | 1.049710 | 1.206670 | 1.460732 |
Numerical data
The following is the status of the technical indicators and moving averages at the time of publication of this technical analysis:
Technical indicators
Moving averages
| RSI (14): | 29.85 | |
| MACD (12,26,9): | -0.0130 | |
| Directional Movement: | -27.630945 | |
| AROON (14): | -100.000000 | |
| DEMA (21): | 0.643671 | |
| Parabolic SAR (0,02-0,02-0,2): | 0.671167 | |
| Elder Ray (13): | -0.021979 | |
| Super Trend (3,10): | 0.658742 | |
| Zig ZAG (10): | 0.632170 | |
| VORTEX (21): | 0.8197 | |
| Stochastique (14,3,5): | 3.09 | |
| TEMA (21): | 0.640958 | |
| Williams %R (14): | -93.80 | |
| Chande Momentum Oscillator (20): | -0.023940 | |
| Repulse (5,40,3): | -2.7445 | |
| ROCnROLL: | 2 | |
| TRIX (15,9): | -0.2157 | |
| Courbe Coppock: | 7.17 |
| MA7: | 0.702196 | |
| MA20: | 0.708958 | |
| MA50: | 0.781697 | |
| MA100: | 0.486960 | |
| MAexp7: | 0.645179 | |
| MAexp20: | 0.660092 | |
| MAexp50: | 0.681297 | |
| MAexp100: | 0.694760 | |
| Price / MA7: | -9.91% | |
| Price / MA20: | -10.77% | |
| Price / MA50: | -19.07% | |
| Price / MA100: | +29.91% | |
| Price / MAexp7: | -1.95% | |
| Price / MAexp20: | -4.16% | |
| Price / MAexp50: | -7.15% | |
| Price / MAexp100: | -8.95% |
Quotes :
-
Real time data
-
Cryptocompare