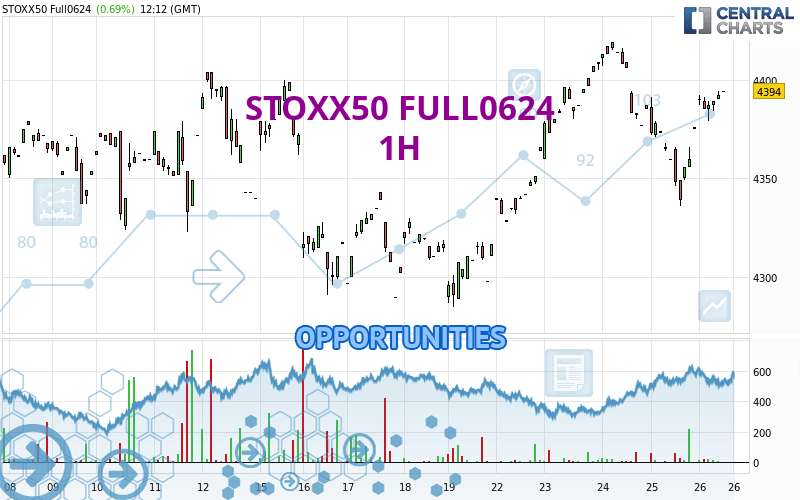
Londinia Opportunities Analyses - 04/26/2024 (GMT) STOXX50 FULL0624 - 1H
-
EUR
(-)
-
15 min delayed data - EUREX Futures
| Type: | Futures |
| Ticker: | STXXXXX |
| ISIN: | STXXXXX |
I am delighted to see that my first price objective has been achieved. I hope you've taken advantage of it.
- FX/Indices
- Timeframe : 1H
- - Analysis generated on
- Status : TARGET REACHED
Summary of the analysis
Trends
Short term:
Bullish
Underlying:
Strongly bullish
Technical indicators
78%
0%
22%
My opinion
Bullish above 4,379.13 EUR
My targets
4,422.00 EUR (+0.64%)
4,442.00 EUR (+1.09%)
My analysis
All elements being clearly bullish, it would be possible for traders to trade only long positions (at the time of purchase) on STOXX50 FULL0624 as long as the price remains well above 4,379.13 EUR. The buyers' bullish objective is set at 4,422.00 EUR. A bullish break in this resistance would boost the bullish momentum. The buyers could then target the resistance located at 4,442.00 EUR. Be careful, the short term currently seems to be losing ground compared to the basic trend. Longer time units should be analysed to identify possible overbought items that could be a sign of a possible short-term correction.
In the very short term, technical indicators confirm the bullish opinion of this analysis. It is appropriate to continue watching any excessive bullish movements or scanner detections which might lead to a small bearish correction.
Force
0
10
7.9

Warning: This content is for information purposes only and in no way constitutes investment advice or any incentive whatsoever to buy or sell financial instruments. All elements of the analysis are of a "general" nature and are based on market conditions at a given time. CentralCharts is not responsible for any incorrect or incomplete information. Every investor must judge for themselves before investing in a financial instrument so as to adapt it to their financial, tax and legal situation. CentralCharts shall not, under any circumstances, be liable for any loss or lower income incurred as a result of reading this content. Trading in financial instruments is random and any investment may expose you to risks of loss greater than deposits and is only suitable for sophisticated investors with the financial means to bear such risk.
Additional analysis
Quotes
The STOXX50 FULL0624 price is 4,394.00 EUR. On the day, this instrument gained +0.69% and was between 4,379.00 EUR and 4,394.00 EUR. This implies that the price is at +0.34% from its lowest and at 0% from its highest.4,379.00
4,394.00
4,394.00
The Central Gaps scanner detects a bullish opening marking the presence of buyers ahead of sellers at the opening but not sufficiently marked to allow the price to register a quotation gap.
Bullish opening
Type : Bullish
Timeframe : Openning
A study of price movements over other periods shows the following variations:
Near a new HIGH record (5 years)
Type : Bullish
Timeframe : Weekly
Near a new HIGH record (1 year)
Type : Bullish
Timeframe : Weekly
Near a new HIGH record (1st january)
Type : Bullish
Timeframe : Weekly
Near a new LOW record (1 month)
Type : Bearish
Timeframe : Weekly
Technical
A technical analysis in 1H of this STOXX50 FULL0624 chart shows a strongly bullish trend. The signals given by moving averages are 89.29% bullish. This strongly bullish trend seems to be running out of steam given the signals being given by short-term moving averages. The Central Indicators market scanner currently does not detect any result that concerns moving averages.
An assessment of technical indicators shows a strong bullish signal.
But beware of excesses. The Central Indicators scanner currently detects this:
Williams %R indicator is overbought : over -20
Type : Neutral
Timeframe : 1 hour
Pivot points : price is over resistance 1
Type : Neutral
Timeframe : 1 hour
Pivot points : price is over resistance 1
Type : Neutral
Timeframe : Weekly
No signals are given by Central Patterns, a market scanner specialised in chart patterns, resistances and supports.
There is also a Japanese candlestick pattern detected by Central Candlesticks that could mark the end of the current short-term trend:
Doji
Type : Neutral
Timeframe : 1 hour
ProTrendLines
S3
S2
S1
R1
R2
R3
Price
| S3 | S2 | S1 | Price | R1 | R2 | R3 | |
|---|---|---|---|---|---|---|---|
| ProTrendLines | 4,323.50 | 4,339.50 | 4,379.13 | 4,394.00 | 4,403.70 | 4,422.00 | 4,442.00 |
| Change (%) | -1.60% | -1.24% | -0.34% | - | +0.22% | +0.64% | +1.09% |
| Change | -70.50 | -54.50 | -14.87 | - | +9.70 | +28.00 | +48.00 |
| Level | Minor | Intermediate | Major | - | Intermediate | Major | Minor |
To determine price objectives, it is also possible to use the pivot points. Here is the price position in relation to pivot points:
Daily
| Pivot points | S3 | S2 | S1 | PP | R1 | R2 | R3 |
|---|---|---|---|---|---|---|---|
| Standard | 4,281.33 | 4,308.67 | 4,336.33 | 4,363.67 | 4,391.33 | 4,418.67 | 4,446.33 |
| Camarilla | 4,348.88 | 4,353.92 | 4,358.96 | 4,364.00 | 4,369.04 | 4,374.08 | 4,379.13 |
| Woodie | 4,281.50 | 4,308.75 | 4,336.50 | 4,363.75 | 4,391.50 | 4,418.75 | 4,446.50 |
| Fibonacci | 4,308.67 | 4,329.68 | 4,342.66 | 4,363.67 | 4,384.68 | 4,397.66 | 4,418.67 |
Weekly
| Pivot points | S3 | S2 | S1 | PP | R1 | R2 | R3 |
|---|---|---|---|---|---|---|---|
| Standard | 4,154.33 | 4,219.67 | 4,268.33 | 4,333.67 | 4,382.33 | 4,447.67 | 4,496.33 |
| Camarilla | 4,285.65 | 4,296.10 | 4,306.55 | 4,317.00 | 4,327.45 | 4,337.90 | 4,348.35 |
| Woodie | 4,146.00 | 4,215.50 | 4,260.00 | 4,329.50 | 4,374.00 | 4,443.50 | 4,488.00 |
| Fibonacci | 4,219.67 | 4,263.22 | 4,290.12 | 4,333.67 | 4,377.22 | 4,404.12 | 4,447.67 |
Monthly
| Pivot points | S3 | S2 | S1 | PP | R1 | R2 | R3 |
|---|---|---|---|---|---|---|---|
| Standard | 4,145.00 | 4,204.00 | 4,313.00 | 4,372.00 | 4,481.00 | 4,540.00 | 4,649.00 |
| Camarilla | 4,375.80 | 4,391.20 | 4,406.60 | 4,422.00 | 4,437.40 | 4,452.80 | 4,468.20 |
| Woodie | 4,170.00 | 4,216.50 | 4,338.00 | 4,384.50 | 4,506.00 | 4,552.50 | 4,674.00 |
| Fibonacci | 4,204.00 | 4,268.18 | 4,307.82 | 4,372.00 | 4,436.18 | 4,475.82 | 4,540.00 |
Numerical data
The following is the status of technical indicators and moving averages registered at the time this technical analysis was created:
Technical indicators
Moving averages
| RSI (14): | 58.74 | |
| MACD (12,26,9): | 3.2300 | |
| Directional Movement: | 4.87 | |
| AROON (14): | 57.15 | |
| DEMA (21): | 4,383.57 | |
| Parabolic SAR (0,02-0,02-0,2): | 4,353.50 | |
| Elder Ray (13): | 12.58 | |
| Super Trend (3,10): | 4,367.06 | |
| Zig ZAG (10): | 4,394.00 | |
| VORTEX (21): | 0.7900 | |
| Stochastique (14,3,5): | 97.06 | |
| TEMA (21): | 4,381.78 | |
| Williams %R (14): | 0.00 | |
| Chande Momentum Oscillator (20): | 28.00 | |
| Repulse (5,40,3): | 0.0700 | |
| ROCnROLL: | 1 | |
| TRIX (15,9): | 0.0000 | |
| Courbe Coppock: | 0.28 |
| MA7: | 4,360.43 | |
| MA20: | 4,360.60 | |
| MA50: | 4,336.76 | |
| MA100: | 4,223.32 | |
| MAexp7: | 4,385.79 | |
| MAexp20: | 4,379.87 | |
| MAexp50: | 4,371.39 | |
| MAexp100: | 4,363.84 | |
| Price / MA7: | +0.77% | |
| Price / MA20: | +0.77% | |
| Price / MA50: | +1.32% | |
| Price / MA100: | +4.04% | |
| Price / MAexp7: | +0.19% | |
| Price / MAexp20: | +0.32% | |
| Price / MAexp50: | +0.52% | |
| Price / MAexp100: | +0.69% |
Quotes :
-
15 min delayed data
-
Futures EUREX