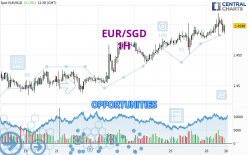
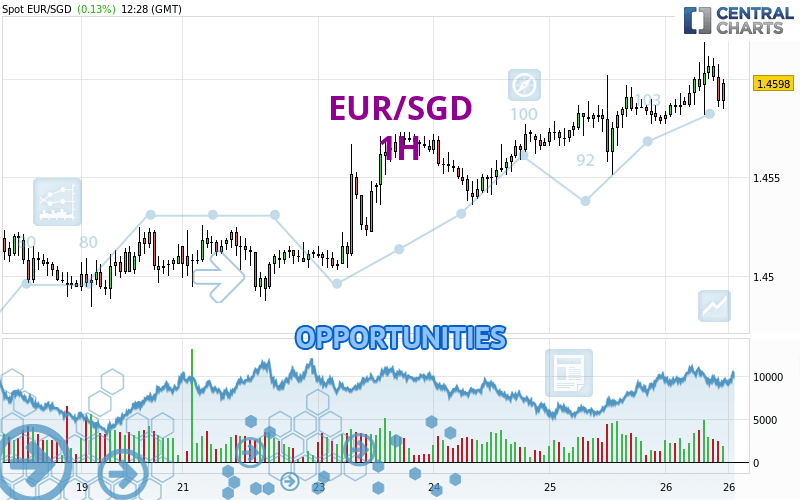
Londinia Opportunities Analyses - 04/26/2024 (GMT) EUR/SGD - 1H
- FX/Indices
- Timeframe : 1H
- - Analysis generated on
- Status : INVALID
Summary of the analysis
Trends
Short term:
Strongly bullish
Underlying:
Strongly bullish
Technical indicators
67%
17%
17%
My opinion
Bullish above 1.4573 SGD
My targets
1.4635 SGD (+0.0036)
1.4670 SGD (+0.0071)
My analysis
All elements being clearly bullish, it would be possible for traders to trade only long positions (at the time of purchase) on EUR/SGD as long as the price remains well above 1.4573 SGD. The buyers' bullish objective is set at 1.4635 SGD. A bullish break in this resistance would boost the bullish momentum. The buyers could then target the resistance located at 1.4670 SGD. If there is any crossing, the next objective would be the resistance located at 1.4751 SGD. However, beware of bullish excesses that could lead to a possible short-term correction; but this possible correction would not be tradeable.
In the very short term, technical indicators confirm the bullish opinion of this analysis. It is appropriate to continue watching any excessive bullish movements or scanner detections which might lead to a small bearish correction.
Force
0
10
7.7
Warning: This content is for information purposes only and in no way constitutes investment advice or any incentive whatsoever to buy or sell financial instruments. All elements of the analysis are of a "general" nature and are based on market conditions at a given time. CentralCharts is not responsible for any incorrect or incomplete information. Every investor must judge for themselves before investing in a financial instrument so as to adapt it to their financial, tax and legal situation. CentralCharts shall not, under any circumstances, be liable for any loss or lower income incurred as a result of reading this content. Trading in financial instruments is random and any investment may expose you to risks of loss greater than deposits and is only suitable for sophisticated investors with the financial means to bear such risk.
Additional analysis
Quotes
The EUR/SGD price is 1.4599 SGD. On the day, this instrument gained +0.14% and was between 1.4577 SGD and 1.4619 SGD. This implies that the price is at +0.15% from its lowest and at -0.14% from its highest.1.4577
1.4619
1.4599
The Central Gaps scanner detects a bullish opening marking the presence of buyers ahead of sellers at the opening but not sufficiently marked to allow the price to register a quotation gap.
Bullish opening
Type : Bullish
Timeframe : Openning
A study of price movements over other periods shows the following variations:
Near a new HIGH record (1 year)
Type : Bullish
Timeframe : Weekly
Near a new LOW record (1st january)
Type : Bearish
Timeframe : Weekly
Near a new LOW record (1 month)
Type : Bearish
Timeframe : Weekly
Technical
Technical analysis of EUR/SGD in 1H shows a strongly overall bullish trend. The signals given by the moving averages are 92.86% bullish. This strong bullish trend is confirmed by the strong signals currently being given by short-term moving averages. The Central Indicators market scanner is currently detecting several bearish and bullish signals that could impact this trend:
Bearish trend reversal : adaptative moving average 20
Type : Bearish
Timeframe : 1 hour
Bullish price crossover with Moving Average 20
Type : Bullish
Timeframe : 1 hour
In fact, according to the parameters integrated into the Central Analyzer system, 12 technical indicators out of 18 analysed are currently bullish. Central Indicators, the detector scanner for these technical indicators has recently detected several signals:
Pivot points : price is over resistance 2
Type : Neutral
Timeframe : Weekly
RSI indicator is back under 50
Type : Bearish
Timeframe : 1 hour
MACD crosses DOWN its Moving Average
Type : Bearish
Timeframe : 1 hour
An analysis of the price chart with the Central Patterns scanner (detector of chart patterns and resistances and supports) shows a result that can have an impact on the price change:
Horizontal resistance is broken
Type : Bullish
Timeframe : 1 hour
The Central Candlesticks scanner which studies Japanese candlesticks did not detect anything.
ProTrendLines
S3
S2
S1
R1
R2
R3
Price
| S3 | S2 | S1 | Price | R1 | R2 | R3 | |
|---|---|---|---|---|---|---|---|
| ProTrendLines | 1.4551 | 1.4573 | 1.4585 | 1.4599 | 1.4602 | 1.4635 | 1.4670 |
| Change (%) | -0.33% | -0.18% | -0.10% | - | +0.02% | +0.25% | +0.49% |
| Change | -0.0048 | -0.0026 | -0.0014 | - | +0.0003 | +0.0036 | +0.0071 |
| Level | Minor | Minor | Intermediate | - | Major | Major | Intermediate |
Attention could also be paid to pivot points to set price objectives:
Daily
| Pivot points | S3 | S2 | S1 | PP | R1 | R2 | R3 |
|---|---|---|---|---|---|---|---|
| Standard | 1.4502 | 1.4526 | 1.4553 | 1.4577 | 1.4604 | 1.4628 | 1.4655 |
| Camarilla | 1.4565 | 1.4570 | 1.4574 | 1.4579 | 1.4584 | 1.4588 | 1.4593 |
| Woodie | 1.4503 | 1.4527 | 1.4554 | 1.4578 | 1.4605 | 1.4629 | 1.4656 |
| Fibonacci | 1.4526 | 1.4546 | 1.4558 | 1.4577 | 1.4597 | 1.4609 | 1.4628 |
Weekly
| Pivot points | S3 | S2 | S1 | PP | R1 | R2 | R3 |
|---|---|---|---|---|---|---|---|
| Standard | 1.4405 | 1.4433 | 1.4471 | 1.4499 | 1.4537 | 1.4565 | 1.4603 |
| Camarilla | 1.4492 | 1.4498 | 1.4504 | 1.4510 | 1.4516 | 1.4522 | 1.4528 |
| Woodie | 1.4411 | 1.4436 | 1.4477 | 1.4502 | 1.4543 | 1.4568 | 1.4609 |
| Fibonacci | 1.4433 | 1.4458 | 1.4474 | 1.4499 | 1.4524 | 1.4540 | 1.4565 |
Monthly
| Pivot points | S3 | S2 | S1 | PP | R1 | R2 | R3 |
|---|---|---|---|---|---|---|---|
| Standard | 1.4375 | 1.4446 | 1.4506 | 1.4577 | 1.4637 | 1.4708 | 1.4768 |
| Camarilla | 1.4531 | 1.4543 | 1.4555 | 1.4567 | 1.4579 | 1.4591 | 1.4603 |
| Woodie | 1.4371 | 1.4443 | 1.4502 | 1.4574 | 1.4633 | 1.4705 | 1.4764 |
| Fibonacci | 1.4446 | 1.4496 | 1.4527 | 1.4577 | 1.4627 | 1.4658 | 1.4708 |
Numerical data
The following is the status of the technical indicators and moving averages at the time of publication of this technical analysis:
Technical indicators
Moving averages
| RSI (14): | 55.24 | |
| MACD (12,26,9): | 0.0006 | |
| Directional Movement: | -0.7962 | |
| AROON (14): | 64.2857 | |
| DEMA (21): | 1.4598 | |
| Parabolic SAR (0,02-0,02-0,2): | 1.4581 | |
| Elder Ray (13): | -0.0004 | |
| Super Trend (3,10): | 1.4570 | |
| Zig ZAG (10): | 1.4596 | |
| VORTEX (21): | 1.0418 | |
| Stochastique (14,3,5): | 43.65 | |
| TEMA (21): | 1.4599 | |
| Williams %R (14): | -57.14 | |
| Chande Momentum Oscillator (20): | 0.0013 | |
| Repulse (5,40,3): | -0.0177 | |
| ROCnROLL: | 1 | |
| TRIX (15,9): | 0.0056 | |
| Courbe Coppock: | 0.18 |
| MA7: | 1.4546 | |
| MA20: | 1.4550 | |
| MA50: | 1.4561 | |
| MA100: | 1.4552 | |
| MAexp7: | 1.4596 | |
| MAexp20: | 1.4591 | |
| MAexp50: | 1.4579 | |
| MAexp100: | 1.4562 | |
| Price / MA7: | +0.36% | |
| Price / MA20: | +0.34% | |
| Price / MA50: | +0.26% | |
| Price / MA100: | +0.32% | |
| Price / MAexp7: | +0.02% | |
| Price / MAexp20: | +0.05% | |
| Price / MAexp50: | +0.14% | |
| Price / MAexp100: | +0.25% |
Quotes :
-
Real time data
-
Forex