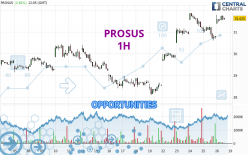
Londinia Opportunities Analyses - 04/26/2024 (GMT) PROSUS - 1H
-
EUR
(-)
-
15 min delayed data - Euronext Amsterdam
| Type: | Stocks |
| Ticker: | PRX |
| ISIN: | NL0013654783 |
I am delighted to see that my first price objective has been achieved. I hope you've taken advantage of it.
- Europe Stocks
- Timeframe : 1H
- - Analysis generated on
- Status : TARGET REACHED
Summary of the analysis
Trends
Short term:
Bullish
Underlying:
Strongly bullish
Technical indicators
72%
6%
22%
My opinion
Bullish above 31.335 EUR
My targets
31.865 EUR (+0.90%)
33.240 EUR (+5.26%)
My analysis
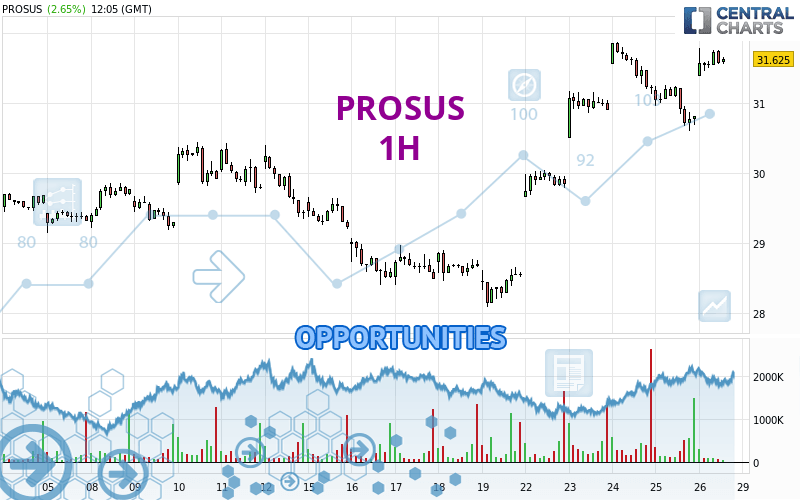
All elements being clearly bullish, it would be possible for traders to trade only long positions (at the time of purchase) on PROSUS as long as the price remains well above 31.335 EUR. The buyers' bullish objective is set at 31.865 EUR. A bullish break in this resistance would boost the bullish momentum. The buyers could then target the resistance located at 33.240 EUR. If there is any crossing, the next objective would be the resistance located at 35.999 EUR. Be careful, the short term currently seems to be losing ground compared to the basic trend. Longer time units should be analysed to identify possible overbought items that could be a sign of a possible short-term correction.
Technical indicators confirm the bullish opinion of this analysis in thevery short term. However, be careful of excessive bullish movements. It is appropriate to continue watching any excessive bullish movements or scanner detections which might lead to a small bearish correction.
Force
0
10
7.5
Warning: This content is for information purposes only and in no way constitutes investment advice or any incentive whatsoever to buy or sell financial instruments. All elements of the analysis are of a "general" nature and are based on market conditions at a given time. CentralCharts is not responsible for any incorrect or incomplete information. Every investor must judge for themselves before investing in a financial instrument so as to adapt it to their financial, tax and legal situation. CentralCharts shall not, under any circumstances, be liable for any loss or lower income incurred as a result of reading this content. Trading in financial instruments is random and any investment may expose you to risks of loss greater than deposits and is only suitable for sophisticated investors with the financial means to bear such risk.
Additional analysis
Quotes
PROSUS rating 31.580 EUR. The price registered an increase of +2.50% on the session and was between 31.375 EUR and 31.780 EUR. This implies that the price is at +0.65% from its lowest and at -0.63% from its highest.31.375
31.780
31.580
A bullish gap was detected at the opening by the Central Gaps scanner. There are a lot of buyers and they have the upper hand in the very short term.
Opening Gap UP
Type : Bullish
Timeframe : Openning
Here is a more detailed summary of the historical variations registered by PROSUS:
Near a new HIGH record (1 year)
Type : Bullish
Timeframe : Weekly
Near a new HIGH record (1st january)
Type : Bullish
Timeframe : Weekly
Near a new HIGH record (1 month)
Type : Bullish
Timeframe : Weekly
Technical
Technical analysis of this 1H chart of PROSUS indicates that the overall trend is strongly bullish. The signals given by moving averages are 89.29% bullish. This strongly bullish trend seems to be running out of steam given the signals being given by short-term moving averages. The Central Indicators scanner does not detect any result on moving averages that would impact this trend.
In fact, 13 technical indicators on 18 studied are currently bullish. But beware of excesses. The Central Indicators scanner currently detects this:
Williams %R indicator is overbought : over -20
Type : Neutral
Timeframe : 1 hour
Pivot points : price is over resistance 2
Type : Neutral
Timeframe : 1 hour
Pivot points : price is over resistance 3
Type : Neutral
Timeframe : Weekly
The Central Patterns scanner, which studies chart patterns, resistances and supports, has identified this signal:
Near resistance of channel
Type : Bearish
Timeframe : 1 hour
No result was found by the Central Candlesticks scanner on Japanese candlesticks.
ProTrendLines
S3
S2
S1
R1
R2
R3
Price
| S3 | S2 | S1 | Price | R1 | R2 | R3 | |
|---|---|---|---|---|---|---|---|
| ProTrendLines | 30.423 | 30.955 | 31.335 | 31.580 | 31.865 | 33.240 | 35.999 |
| Change (%) | -3.66% | -1.98% | -0.78% | - | +0.90% | +5.26% | +13.99% |
| Change | -1.157 | -0.625 | -0.245 | - | +0.285 | +1.660 | +4.419 |
| Level | Intermediate | Minor | Intermediate | - | Intermediate | Minor | Intermediate |
Attention could also be paid to pivot points to set price objectives:
Daily
| Pivot points | S3 | S2 | S1 | PP | R1 | R2 | R3 |
|---|---|---|---|---|---|---|---|
| Standard | 29.858 | 30.227 | 30.518 | 30.887 | 31.178 | 31.547 | 31.838 |
| Camarilla | 30.629 | 30.689 | 30.750 | 30.810 | 30.871 | 30.931 | 30.992 |
| Woodie | 29.820 | 30.208 | 30.480 | 30.868 | 31.140 | 31.528 | 31.800 |
| Fibonacci | 30.227 | 30.479 | 30.635 | 30.887 | 31.139 | 31.295 | 31.547 |
Weekly
| Pivot points | S3 | S2 | S1 | PP | R1 | R2 | R3 |
|---|---|---|---|---|---|---|---|
| Standard | 26.287 | 27.183 | 27.862 | 28.758 | 29.437 | 30.333 | 31.012 |
| Camarilla | 28.107 | 28.251 | 28.396 | 28.540 | 28.684 | 28.829 | 28.973 |
| Woodie | 26.178 | 27.129 | 27.753 | 28.704 | 29.328 | 30.279 | 30.903 |
| Fibonacci | 27.183 | 27.785 | 28.157 | 28.758 | 29.360 | 29.732 | 30.333 |
Monthly
| Pivot points | S3 | S2 | S1 | PP | R1 | R2 | R3 |
|---|---|---|---|---|---|---|---|
| Standard | 23.230 | 24.475 | 26.775 | 28.020 | 30.320 | 31.565 | 33.865 |
| Camarilla | 28.100 | 28.425 | 28.750 | 29.075 | 29.400 | 29.725 | 30.050 |
| Woodie | 23.758 | 24.739 | 27.303 | 28.284 | 30.848 | 31.829 | 34.393 |
| Fibonacci | 24.475 | 25.829 | 26.666 | 28.020 | 29.374 | 30.211 | 31.565 |
Numerical data
The following is the status of technical indicators and moving averages registered at the time this technical analysis was created:
Technical indicators
Moving averages
| RSI (14): | 63.15 | |
| MACD (12,26,9): | 0.2370 | |
| Directional Movement: | 21.565 | |
| AROON (14): | 14.286 | |
| DEMA (21): | 31.554 | |
| Parabolic SAR (0,02-0,02-0,2): | 30.687 | |
| Elder Ray (13): | 0.349 | |
| Super Trend (3,10): | 30.932 | |
| Zig ZAG (10): | 31.625 | |
| VORTEX (21): | 0.8630 | |
| Stochastique (14,3,5): | 87.34 | |
| TEMA (21): | 31.452 | |
| Williams %R (14): | -16.46 | |
| Chande Momentum Oscillator (20): | 0.535 | |
| Repulse (5,40,3): | -0.0770 | |
| ROCnROLL: | 1 | |
| TRIX (15,9): | 0.1050 | |
| Courbe Coppock: | 0.32 |
| MA7: | 30.217 | |
| MA20: | 29.655 | |
| MA50: | 28.396 | |
| MA100: | 28.297 | |
| MAexp7: | 31.436 | |
| MAexp20: | 31.221 | |
| MAexp50: | 30.671 | |
| MAexp100: | 30.120 | |
| Price / MA7: | +4.51% | |
| Price / MA20: | +6.49% | |
| Price / MA50: | +11.21% | |
| Price / MA100: | +11.60% | |
| Price / MAexp7: | +0.46% | |
| Price / MAexp20: | +1.15% | |
| Price / MAexp50: | +2.96% | |
| Price / MAexp100: | +4.85% |
Quotes :
-
15 min delayed data
-
Euronext Amsterdam
News
The latest news and videos published on PROSUS at the time of the analysis were as follows:
- Prosus N.V.: Results of Annual General Meeting
- Removal of the Cross-holding Structure Update: Publication of the Notice of Annual General Meeting and Naspers Circular
- Prosus N.V.: Notice of Hybrid Annual General Meeting and Cash Dividend Declaration
- Naspers and Prosus Announce the Intention to Remove the Cross-Holding Structure
- Prosus Delivers Against Strategic Objectives and Is On-Track to Achieve Profitability Target