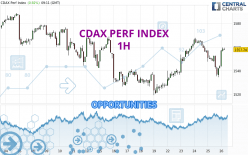
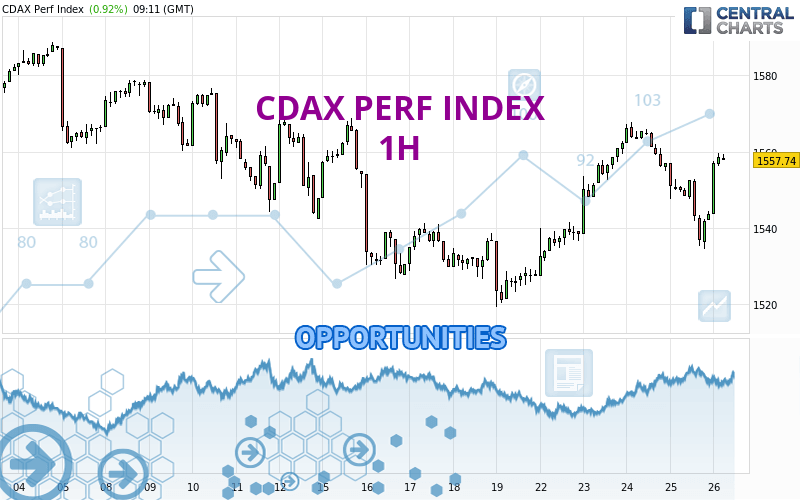
Londinia Opportunities Analyses - 04/26/2024 (GMT) CDAX PERF INDEX - 1H
| Type: | Indices |
| Ticker: | CDAX |
| ISIN: | DE0008469602 |
- FX/Indices
- Timeframe : 1H
- - Analysis generated on
- Status : TARGET REACHED
Summary of the analysis
Additional analysis
Quotes
The CDAX PERF INDEX price is 1,559.33 EUR. On the day, this instrument gained +1.02% and was between 1,543.54 EUR and 1,559.64 EUR. This implies that the price is at +1.02% from its lowest and at -0.02% from its highest.Here is a more detailed summary of the historical variations registered by CDAX PERF INDEX:
Near a new HIGH record (5 years)
Type : Bullish
Timeframe : Weekly
Near a new HIGH record (1 year)
Type : Bullish
Timeframe : Weekly
Near a new HIGH record (1st january)
Type : Bullish
Timeframe : Weekly
Near a new HIGH record (1 month)
Type : Bullish
Timeframe : Weekly
Technical
A technical analysis in 1H of this CDAX PERF INDEX chart shows a strongly bullish trend. The signals given by moving averages are 85.71% bullish. This strongly bullish trend seems to be running out of steam given the signals being given by short-term moving averages. An assessment of moving averages reveals a bullish signal that could impact this trend:
Moving Average bullish crossovers : MA50 & MA100
Type : Bullish
Timeframe : 1 hour
Technical indicators are strongly bullish, suggesting that the price increase should continue.
Caution: the Central Indicators scanner currently detects an excess:
Williams %R indicator is overbought : over -20
Type : Neutral
Timeframe : 1 hour
Pivot points : price is over resistance 1
Type : Neutral
Timeframe : 1 hour
Pivot points : price is over resistance 1
Type : Neutral
Timeframe : Weekly
MACD crosses UP its Moving Average
Type : Bullish
Timeframe : 1 hour
Momentum indicator is back over 0
Type : Bullish
Timeframe : 1 hour
No signals are given by Central Patterns, a market scanner specialised in chart patterns, resistances and supports.
Central Candlesticks, the scanner specialised in Japanese candlesticks, detects a bearish signal that could support the hypothesis of a small drop in the very short term:
Bearish harami cross
Type : Bearish
Timeframe : 1 hour
| S3 | S2 | S1 | Price | R1 | R2 | R3 | |
|---|---|---|---|---|---|---|---|
| ProTrendLines | 1,525.31 | 1,538.77 | 1,551.56 | 1,559.33 | 1,568.16 | 1,579.03 | 1,589.96 |
| Change (%) | -2.18% | -1.32% | -0.50% | - | +0.57% | +1.26% | +1.96% |
| Change | -34.02 | -20.56 | -7.77 | - | +8.83 | +19.70 | +30.63 |
| Level | Major | Minor | Intermediate | - | Major | Minor | Major |
Attention could also be paid to pivot points to set price objectives:
| Pivot points | S3 | S2 | S1 | PP | R1 | R2 | R3 |
|---|---|---|---|---|---|---|---|
| Standard | 1,510.29 | 1,522.35 | 1,532.94 | 1,545.00 | 1,555.59 | 1,567.65 | 1,578.24 |
| Camarilla | 1,537.31 | 1,539.39 | 1,541.46 | 1,543.54 | 1,545.62 | 1,547.69 | 1,549.77 |
| Woodie | 1,509.57 | 1,521.98 | 1,532.22 | 1,544.63 | 1,554.87 | 1,567.28 | 1,577.52 |
| Fibonacci | 1,522.35 | 1,531.00 | 1,536.34 | 1,545.00 | 1,553.65 | 1,558.99 | 1,567.65 |
| Pivot points | S3 | S2 | S1 | PP | R1 | R2 | R3 |
|---|---|---|---|---|---|---|---|
| Standard | 1,458.23 | 1,488.69 | 1,508.00 | 1,538.46 | 1,557.77 | 1,588.23 | 1,607.54 |
| Camarilla | 1,513.63 | 1,518.20 | 1,522.76 | 1,527.32 | 1,531.88 | 1,536.45 | 1,541.01 |
| Woodie | 1,452.67 | 1,485.90 | 1,502.44 | 1,535.67 | 1,552.21 | 1,585.44 | 1,601.98 |
| Fibonacci | 1,488.69 | 1,507.70 | 1,519.45 | 1,538.46 | 1,557.47 | 1,569.22 | 1,588.23 |
| Pivot points | S3 | S2 | S1 | PP | R1 | R2 | R3 |
|---|---|---|---|---|---|---|---|
| Standard | 1,472.57 | 1,496.63 | 1,543.30 | 1,567.36 | 1,614.03 | 1,638.09 | 1,684.76 |
| Camarilla | 1,570.51 | 1,576.99 | 1,583.48 | 1,589.96 | 1,596.44 | 1,602.93 | 1,609.41 |
| Woodie | 1,483.87 | 1,502.28 | 1,554.60 | 1,573.01 | 1,625.33 | 1,643.74 | 1,696.06 |
| Fibonacci | 1,496.63 | 1,523.65 | 1,540.34 | 1,567.36 | 1,594.38 | 1,611.07 | 1,638.09 |
Numerical data
The following are the details of the technical indicators and moving averages that were collected to generate this technical analysis:
| RSI (14): | 57.76 | |
| MACD (12,26,9): | 0.6600 | |
| Directional Movement: | 7.34 | |
| AROON (14): | -71.43 | |
| DEMA (21): | 1,553.10 | |
| Parabolic SAR (0,02-0,02-0,2): | 1,535.85 | |
| Elder Ray (13): | 6.41 | |
| Super Trend (3,10): | 1,543.09 | |
| Zig ZAG (10): | 1,558.51 | |
| VORTEX (21): | 0.9800 | |
| Stochastique (14,3,5): | 84.62 | |
| TEMA (21): | 1,551.26 | |
| Williams %R (14): | -8.05 | |
| Chande Momentum Oscillator (20): | 1.80 | |
| Repulse (5,40,3): | 0.6500 | |
| ROCnROLL: | 1 | |
| TRIX (15,9): | 0.0100 | |
| Courbe Coppock: | 1.28 |
| MA7: | 1,546.26 | |
| MA20: | 1,556.98 | |
| MA50: | 1,541.50 | |
| MA100: | 1,498.77 | |
| MAexp7: | 1,552.76 | |
| MAexp20: | 1,551.74 | |
| MAexp50: | 1,549.10 | |
| MAexp100: | 1,549.65 | |
| Price / MA7: | +0.85% | |
| Price / MA20: | +0.15% | |
| Price / MA50: | +1.16% | |
| Price / MA100: | +4.04% | |
| Price / MAexp7: | +0.42% | |
| Price / MAexp20: | +0.49% | |
| Price / MAexp50: | +0.66% | |
| Price / MAexp100: | +0.62% |