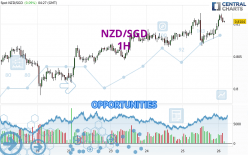
Londinia Opportunities Analyses - 04/26/2024 (GMT) NZD/SGD - 1H
- FX/Indices
- Timeframe : 1H
- - Analysis generated on
- Status : INVALID
Summary of the analysis
Trends
Short term:
Bullish
Underlying:
Strongly bullish
Technical indicators
83%
6%
11%
My opinion
Bullish above 0.8092 SGD
My targets
0.8117 SGD (+0.0013)
0.8155 SGD (+0.0051)
My analysis
All elements being clearly bullish, it would be possible for traders to trade only long positions (at the time of purchase) on NZD/SGD as long as the price remains well above 0.8092 SGD. The buyers' bullish objective is set at 0.8117 SGD. A bullish break in this resistance would boost the bullish momentum. The buyers could then target the resistance located at 0.8155 SGD. If there is any crossing, the next objective would be the resistance located at 0.8226 SGD. Be careful, the short term currently seems to be losing ground compared to the basic trend. Longer time units should be analysed to identify possible overbought items that could be a sign of a possible short-term correction.
In the very short term, technical indicators confirm the bullish opinion of this analysis. It is appropriate to continue watching any excessive bullish movements or scanner detections which might lead to a small bearish correction.
Force
0
10
7.9

Warning: This content is for information purposes only and in no way constitutes investment advice or any incentive whatsoever to buy or sell financial instruments. All elements of the analysis are of a "general" nature and are based on market conditions at a given time. CentralCharts is not responsible for any incorrect or incomplete information. Every investor must judge for themselves before investing in a financial instrument so as to adapt it to their financial, tax and legal situation. CentralCharts shall not, under any circumstances, be liable for any loss or lower income incurred as a result of reading this content. Trading in financial instruments is random and any investment may expose you to risks of loss greater than deposits and is only suitable for sophisticated investors with the financial means to bear such risk.
Additional analysis
Quotes
NZD/SGD rating 0.8104 SGD. The price registered an increase of +0.09% on the session and was traded between 0.8095 SGD and 0.8116 SGD over the period. The price is currently at +0.11% from its lowest and -0.15% from its highest.0.8095
0.8116
0.8104
So that you have an overall view of the price change, here is a table showing the variations over several periods:
Near a new LOW record (5 years)
Type : Bearish
Timeframe : Weekly
Near a new HIGH record (1 year)
Type : Bullish
Timeframe : Weekly
Near a new HIGH record (1st january)
Type : Bullish
Timeframe : Weekly
Near a new LOW record (1 month)
Type : Bearish
Timeframe : Weekly
Technical
A technical analysis in 1H of this NZD/SGD chart shows a strongly bullish trend. The signals given by moving averages are 89.29% bullish. This strongly bullish trend seems to be running out of steam given the signals being given by short-term moving averages. The Central Indicators market scanner currently does not detect any result that concerns moving averages.
Technical indicators are strongly bullish, suggesting that the price increase should continue.
Central Indicators, the scanner specialised in technical indicators, has identified this signal:
Pivot points : price is over resistance 1
Type : Neutral
Timeframe : Weekly
Central Patterns, the market scanner focusing on chart patterns, resistances and supports found this result:
Near resistance of channel
Type : Bearish
Timeframe : 1 hour
The Central Candlesticks scanner which studies Japanese candlesticks did not detect anything.
ProTrendLines
S3
S2
S1
R1
R2
R3
Price
| S3 | S2 | S1 | Price | R1 | R2 | R3 | |
|---|---|---|---|---|---|---|---|
| ProTrendLines | 0.8052 | 0.8066 | 0.8092 | 0.8104 | 0.8117 | 0.8155 | 0.8226 |
| Change (%) | -0.64% | -0.47% | -0.15% | - | +0.16% | +0.63% | +1.51% |
| Change | -0.0052 | -0.0038 | -0.0012 | - | +0.0013 | +0.0051 | +0.0122 |
| Level | Minor | Major | Minor | - | Intermediate | Intermediate | Major |
To determine price objectives, it is also possible to use the pivot points. Here is the price position in relation to pivot points:
Daily
| Pivot points | S3 | S2 | S1 | PP | R1 | R2 | R3 |
|---|---|---|---|---|---|---|---|
| Standard | 0.8019 | 0.8042 | 0.8070 | 0.8093 | 0.8121 | 0.8144 | 0.8172 |
| Camarilla | 0.8083 | 0.8088 | 0.8092 | 0.8097 | 0.8102 | 0.8106 | 0.8111 |
| Woodie | 0.8021 | 0.8043 | 0.8072 | 0.8094 | 0.8123 | 0.8145 | 0.8174 |
| Fibonacci | 0.8042 | 0.8062 | 0.8074 | 0.8093 | 0.8113 | 0.8125 | 0.8144 |
Weekly
| Pivot points | S3 | S2 | S1 | PP | R1 | R2 | R3 |
|---|---|---|---|---|---|---|---|
| Standard | 0.7865 | 0.7927 | 0.7973 | 0.8035 | 0.8081 | 0.8143 | 0.8189 |
| Camarilla | 0.7988 | 0.7998 | 0.8008 | 0.8018 | 0.8028 | 0.8038 | 0.8048 |
| Woodie | 0.7856 | 0.7923 | 0.7964 | 0.8031 | 0.8072 | 0.8139 | 0.8180 |
| Fibonacci | 0.7927 | 0.7969 | 0.7994 | 0.8035 | 0.8077 | 0.8102 | 0.8143 |
Monthly
| Pivot points | S3 | S2 | S1 | PP | R1 | R2 | R3 |
|---|---|---|---|---|---|---|---|
| Standard | 0.7778 | 0.7912 | 0.7991 | 0.8125 | 0.8204 | 0.8338 | 0.8417 |
| Camarilla | 0.8010 | 0.8030 | 0.8050 | 0.8069 | 0.8089 | 0.8108 | 0.8128 |
| Woodie | 0.7750 | 0.7898 | 0.7963 | 0.8111 | 0.8176 | 0.8324 | 0.8389 |
| Fibonacci | 0.7912 | 0.7994 | 0.8044 | 0.8125 | 0.8207 | 0.8257 | 0.8338 |
Numerical data
The following is the status of the technical indicators and moving averages at the time of publication of this technical analysis:
Technical indicators
Moving averages
| RSI (14): | 57.76 | |
| MACD (12,26,9): | 0.0005 | |
| Directional Movement: | 8.2514 | |
| AROON (14): | 85.7143 | |
| DEMA (21): | 0.8101 | |
| Parabolic SAR (0,02-0,02-0,2): | 0.8074 | |
| Elder Ray (13): | 0.0005 | |
| Super Trend (3,10): | 0.8078 | |
| Zig ZAG (10): | 0.8102 | |
| VORTEX (21): | 1.0437 | |
| Stochastique (14,3,5): | 76.11 | |
| TEMA (21): | 0.8104 | |
| Williams %R (14): | -30.00 | |
| Chande Momentum Oscillator (20): | 0.0020 | |
| Repulse (5,40,3): | -0.0454 | |
| ROCnROLL: | 1 | |
| TRIX (15,9): | 0.0061 | |
| Courbe Coppock: | 0.38 |
| MA7: | 0.8069 | |
| MA20: | 0.8083 | |
| MA50: | 0.8146 | |
| MA100: | 0.8199 | |
| MAexp7: | 0.8102 | |
| MAexp20: | 0.8095 | |
| MAexp50: | 0.8086 | |
| MAexp100: | 0.8077 | |
| Price / MA7: | +0.43% | |
| Price / MA20: | +0.26% | |
| Price / MA50: | -0.52% | |
| Price / MA100: | -1.16% | |
| Price / MAexp7: | +0.02% | |
| Price / MAexp20: | +0.11% | |
| Price / MAexp50: | +0.22% | |
| Price / MAexp100: | +0.33% |
Quotes :
-
Real time data
-
Forex