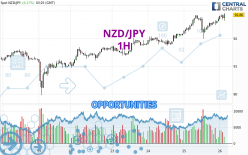
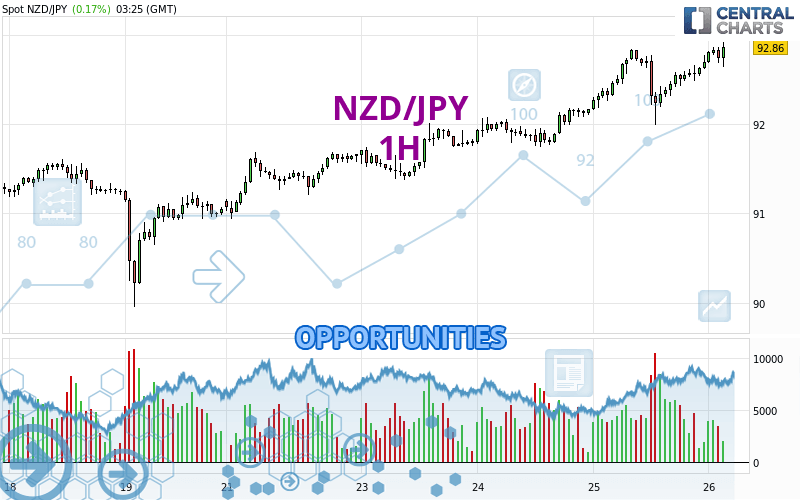
Londinia Opportunities Analyses - 04/26/2024 (GMT) NZD/JPY - 1H
I am delighted to see that my first price objective has been achieved. I hope you've taken advantage of it.
- FX/Indices
- Timeframe : 1H
- - Analysis generated on
- Status : TARGET REACHED
Summary of the analysis
Trends
Short term:
Strongly bullish
Underlying:
Strongly bullish
Technical indicators
72%
0%
28%
My opinion
Bullish above 92.53 JPY
My targets
93.27 JPY (+0.39)
93.84 JPY (+0.96)
My analysis
The bullish trend is currently very strong on NZD/JPY. As long as the price remains above the support at 92.53 JPY, you could try to benefit from the boom. The first bullish objective is located at 93.27 JPY. The bullish momentum would be boosted by a break in this resistance. Buyers would then use the next resistance located at 93.84 JPY as an objective. Be careful, given the powerful bullish rally underway, excesses could lead to a possible correction in the short term. If this is the case, remember that trading against the trend may be riskier. It would seem more appropriate to wait for a signal indicating reversal of the trend.
Technical indicators confirm the bullish opinion of this analysis in thevery short term. However, be careful of excessive bullish movements. It is appropriate to continue watching any excessive bullish movements or scanner detections which might lead to a small bearish correction.
Force
0
10
8.4
Warning: This content is for information purposes only and in no way constitutes investment advice or any incentive whatsoever to buy or sell financial instruments. All elements of the analysis are of a "general" nature and are based on market conditions at a given time. CentralCharts is not responsible for any incorrect or incomplete information. Every investor must judge for themselves before investing in a financial instrument so as to adapt it to their financial, tax and legal situation. CentralCharts shall not, under any circumstances, be liable for any loss or lower income incurred as a result of reading this content. Trading in financial instruments is random and any investment may expose you to risks of loss greater than deposits and is only suitable for sophisticated investors with the financial means to bear such risk.
Additional analysis
Quotes
NZD/JPY rating 92.88 JPY. The price has increased by +0.19% since the last closing with the lowest point at 92.64 JPY and the highest point at 92.91 JPY. The deviation from the price is +0.26% for the low point and -0.03% for the high point.92.64
92.91
92.88
Here is a more detailed summary of the historical variations registered by NZD/JPY:
Near a new HIGH record (5 years)
Type : Bullish
Timeframe : Weekly
Near a new HIGH record (1 year)
Type : Bullish
Timeframe : Weekly
Near a new LOW record (1st january)
Type : Bearish
Timeframe : Weekly
New HIGH record (1 month)
Type : Bullish
Timeframe : Weekly
Technical
A technical analysis in 1H of this NZD/JPY chart shows a strongly bullish trend. 92.86% of the signals given by moving averages are bullish. This strongly bullish trend is supported by the strong bullish signals given by short-term moving averages. The Central Indicators market scanner currently does not detect any result that concerns moving averages.
In fact, according to the parameters integrated into the Central Analyzer system, 13 technical indicators out of 18 analysed are currently bullish. But beware of excesses. The Central Indicators scanner currently detects this:
Williams %R indicator is overbought : over -20
Type : Neutral
Timeframe : 1 hour
Pivot points : price is over resistance 2
Type : Neutral
Timeframe : Weekly
The Central Patterns scanner, which studies chart patterns, resistances and supports, has identified these signals:
Near horizontal resistance
Type : Bearish
Timeframe : 1 hour
Resistance of channel is broken
Type : Bullish
Timeframe : 1 hour
The Central Candlesticks scanner which studies Japanese candlesticks did not detect anything.
ProTrendLines
S3
S2
S1
R1
R2
Price
| S3 | S2 | S1 | Price | R1 | R2 | |
|---|---|---|---|---|---|---|
| ProTrendLines | 91.22 | 92.00 | 92.84 | 92.88 | 93.27 | 93.84 |
| Change (%) | -1.79% | -0.95% | -0.04% | - | +0.42% | +1.03% |
| Change | -1.66 | -0.88 | -0.04 | - | +0.39 | +0.96 |
| Level | Major | Intermediate | Intermediate | - | Intermediate | Major |
Attention could also be paid to pivot points to set price objectives:
Daily
| Pivot points | S3 | S2 | S1 | PP | R1 | R2 | R3 |
|---|---|---|---|---|---|---|---|
| Standard | 91.33 | 91.66 | 92.18 | 92.51 | 93.03 | 93.36 | 93.88 |
| Camarilla | 92.47 | 92.54 | 92.62 | 92.70 | 92.78 | 92.86 | 92.93 |
| Woodie | 91.43 | 91.71 | 92.28 | 92.56 | 93.13 | 93.41 | 93.98 |
| Fibonacci | 91.66 | 91.99 | 92.19 | 92.51 | 92.84 | 93.04 | 93.36 |
Weekly
| Pivot points | S3 | S2 | S1 | PP | R1 | R2 | R3 |
|---|---|---|---|---|---|---|---|
| Standard | 88.47 | 89.21 | 90.13 | 90.87 | 91.79 | 92.53 | 93.45 |
| Camarilla | 90.59 | 90.75 | 90.90 | 91.05 | 91.20 | 91.35 | 91.51 |
| Woodie | 88.56 | 89.26 | 90.22 | 90.92 | 91.88 | 92.58 | 93.54 |
| Fibonacci | 89.21 | 89.84 | 90.24 | 90.87 | 91.50 | 91.90 | 92.53 |
Monthly
| Pivot points | S3 | S2 | S1 | PP | R1 | R2 | R3 |
|---|---|---|---|---|---|---|---|
| Standard | 87.65 | 88.91 | 89.69 | 90.95 | 91.73 | 92.99 | 93.77 |
| Camarilla | 89.92 | 90.11 | 90.29 | 90.48 | 90.67 | 90.85 | 91.04 |
| Woodie | 87.42 | 88.79 | 89.46 | 90.83 | 91.50 | 92.87 | 93.54 |
| Fibonacci | 88.91 | 89.69 | 90.17 | 90.95 | 91.73 | 92.21 | 92.99 |
Numerical data
The following is the status of technical indicators and moving averages registered at the time this technical analysis was created:
Technical indicators
Moving averages
| RSI (14): | 61.77 | |
| MACD (12,26,9): | 0.1300 | |
| Directional Movement: | 5.80 | |
| AROON (14): | 85.71 | |
| DEMA (21): | 92.75 | |
| Parabolic SAR (0,02-0,02-0,2): | 92.29 | |
| Elder Ray (13): | 0.08 | |
| Super Trend (3,10): | 92.36 | |
| Zig ZAG (10): | 92.72 | |
| VORTEX (21): | 1.0800 | |
| Stochastique (14,3,5): | 88.28 | |
| TEMA (21): | 92.76 | |
| Williams %R (14): | -17.91 | |
| Chande Momentum Oscillator (20): | 0.36 | |
| Repulse (5,40,3): | 0.0200 | |
| ROCnROLL: | 1 | |
| TRIX (15,9): | 0.0200 | |
| Courbe Coppock: | 0.43 |
| MA7: | 91.90 | |
| MA20: | 91.45 | |
| MA50: | 91.48 | |
| MA100: | 90.78 | |
| MAexp7: | 92.70 | |
| MAexp20: | 92.59 | |
| MAexp50: | 92.34 | |
| MAexp100: | 92.04 | |
| Price / MA7: | +1.07% | |
| Price / MA20: | +1.56% | |
| Price / MA50: | +1.53% | |
| Price / MA100: | +2.31% | |
| Price / MAexp7: | +0.18% | |
| Price / MAexp20: | +0.30% | |
| Price / MAexp50: | +0.57% | |
| Price / MAexp100: | +0.90% |
Quotes :
-
Real time data
-
Forex
News
Don't forget to follow the news on NZD/JPY. At the time of publication of this analysis, the latest news was as follows:
-
 NZD/JPY Can Take Advantage of, But Not Dependent on Risk Appetite (Quick Takes Video)
-
Technica Focus: Big Confluence in NZD/JPY
-
Why selling the NZD/JPY could be ‘a good short-term trade’