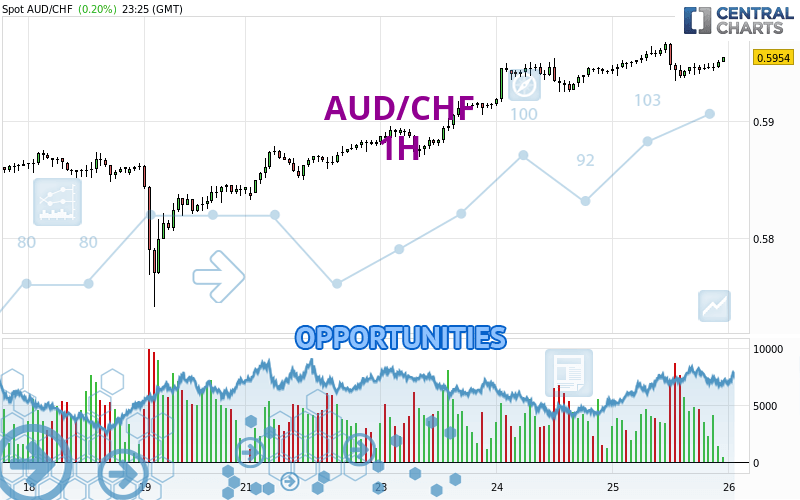
Londinia Opportunities Analyses - 04/25/2024 (GMT) AUD/CHF - 1H
- FX/Indices
- Timeframe : 1H
- - Analysis generated on
- Status : LEVEL MAINTAINED
Summary of the analysis

Additional analysis
Quotes
AUD/CHF rating 0.5953 CHF. The price has increased by +0.19% since the last closing and was between 0.5934 CHF and 0.5967 CHF. This implies that the price is at +0.32% from its lowest and at -0.23% from its highest.So that you have an overall view of the price change, here is a table showing the variations over several periods:
Near a new HIGH record (1 year)
Type : Bullish
Timeframe : Weekly
Near a new HIGH record (1st january)
Type : Bullish
Timeframe : Weekly
Near a new LOW record (1 month)
Type : Bearish
Timeframe : Weekly
Technical
Technical analysis of this 1H chart of AUD/CHF indicates that the overall trend is strongly bullish. 92.86% of the signals given by moving averages are bullish. The overall trend is supported by the strong bullish signals from short-term moving averages. The Central Indicators market scanner is currently detecting several bullish signals that could impact this trend:
Bullish trend reversal : adaptative moving average 20
Type : Bullish
Timeframe : 1 hour
Bullish price crossover with adaptative moving average 20
Type : Bullish
Timeframe : 1 hour
In fact, 11 technical indicators on 18 studied are currently positioned bullish. Central Indicators, the detector scanner for these technical indicators has recently detected several signals:
Pivot points : price is over resistance 1
Type : Neutral
Timeframe : Weekly
Price is back over the pivot point
Type : Bullish
Timeframe : 1 hour
Williams %R indicator is back over -50
Type : Bullish
Timeframe : 1 hour
The Central Patterns scanner, which studies chart patterns, resistances and supports, has identified these signals:
Near horizontal resistance
Type : Bearish
Timeframe : 1 hour
Resistance of channel is broken
Type : Bullish
Timeframe : 1 hour
No result was found by the Central Candlesticks scanner on Japanese candlesticks.
| S3 | S2 | S1 | Price | R1 | R2 | R3 | |
|---|---|---|---|---|---|---|---|
| ProTrendLines | 0.5893 | 0.5924 | 0.5953 | 0.5953 | 0.5985 | 0.6195 | 0.6542 |
| Change (%) | -1.01% | -0.49% | 0% | - | +0.54% | +4.07% | +9.89% |
| Change | -0.0060 | -0.0029 | 0 | - | +0.0032 | +0.0242 | +0.0589 |
| Level | Minor | Minor | Intermediate | - | Intermediate | Minor | Major |
Pivot points can also be used to set your price objectives. Here is the price situation in relation to pivot points:
| Pivot points | S3 | S2 | S1 | PP | R1 | R2 | R3 |
|---|---|---|---|---|---|---|---|
| Standard | 0.5877 | 0.5895 | 0.5918 | 0.5936 | 0.5959 | 0.5977 | 0.6000 |
| Camarilla | 0.5931 | 0.5935 | 0.5938 | 0.5942 | 0.5946 | 0.5950 | 0.5953 |
| Woodie | 0.5881 | 0.5896 | 0.5922 | 0.5937 | 0.5963 | 0.5978 | 0.6004 |
| Fibonacci | 0.5895 | 0.5910 | 0.5920 | 0.5936 | 0.5951 | 0.5961 | 0.5977 |
| Pivot points | S3 | S2 | S1 | PP | R1 | R2 | R3 |
|---|---|---|---|---|---|---|---|
| Standard | 0.5554 | 0.5647 | 0.5745 | 0.5838 | 0.5936 | 0.6029 | 0.6127 |
| Camarilla | 0.5790 | 0.5807 | 0.5825 | 0.5842 | 0.5860 | 0.5877 | 0.5895 |
| Woodie | 0.5556 | 0.5648 | 0.5747 | 0.5839 | 0.5938 | 0.6030 | 0.6129 |
| Fibonacci | 0.5647 | 0.5720 | 0.5765 | 0.5838 | 0.5911 | 0.5956 | 0.6029 |
| Pivot points | S3 | S2 | S1 | PP | R1 | R2 | R3 |
|---|---|---|---|---|---|---|---|
| Standard | 0.5566 | 0.5651 | 0.5762 | 0.5847 | 0.5958 | 0.6043 | 0.6154 |
| Camarilla | 0.5818 | 0.5836 | 0.5854 | 0.5872 | 0.5890 | 0.5908 | 0.5926 |
| Woodie | 0.5578 | 0.5658 | 0.5774 | 0.5854 | 0.5970 | 0.6050 | 0.6166 |
| Fibonacci | 0.5651 | 0.5726 | 0.5773 | 0.5847 | 0.5922 | 0.5969 | 0.6043 |
Numerical data
The following is the status of technical indicators and moving averages registered at the time this technical analysis was created:
| RSI (14): | 55.82 | |
| MACD (12,26,9): | 0.0002 | |
| Directional Movement: | 4.6388 | |
| AROON (14): | -14.2857 | |
| DEMA (21): | 0.5950 | |
| Parabolic SAR (0,02-0,02-0,2): | 0.5956 | |
| Elder Ray (13): | 0.0003 | |
| Super Trend (3,10): | 0.5968 | |
| Zig ZAG (10): | 0.5952 | |
| VORTEX (21): | 1.0301 | |
| Stochastique (14,3,5): | 46.46 | |
| TEMA (21): | 0.5947 | |
| Williams %R (14): | -45.45 | |
| Chande Momentum Oscillator (20): | -0.0014 | |
| Repulse (5,40,3): | 0.0928 | |
| ROCnROLL: | 1 | |
| TRIX (15,9): | 0.0055 | |
| Courbe Coppock: | 0.27 |
| MA7: | 0.5894 | |
| MA20: | 0.5910 | |
| MA50: | 0.5845 | |
| MA100: | 0.5787 | |
| MAexp7: | 0.5948 | |
| MAexp20: | 0.5947 | |
| MAexp50: | 0.5937 | |
| MAexp100: | 0.5919 | |
| Price / MA7: | +1.00% | |
| Price / MA20: | +0.73% | |
| Price / MA50: | +1.85% | |
| Price / MA100: | +2.87% | |
| Price / MAexp7: | +0.08% | |
| Price / MAexp20: | +0.10% | |
| Price / MAexp50: | +0.27% | |
| Price / MAexp100: | +0.57% |
News
The last news published on AUD/CHF at the time of the generation of this analysis was as follows:
-
 AUD/CHF Forecast April 17, 2024
-
Forex Strategy Video: Why AUD/CHF May Have More Attractive Qualities than GBP/USD
-
AUD/CHF Technical Levels