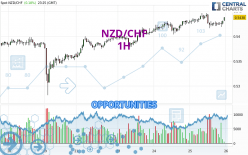
Londinia Opportunities Analyses - 04/25/2024 (GMT) NZD/CHF - 1H
- FX/Indices
- Timeframe : 1H
- - Analysis generated on
- Status : INVALID
Summary of the analysis
Trends
Short term:
Bullish
Underlying:
Strongly bullish
Technical indicators
61%
17%
22%
My opinion
Bullish above 0.5428 CHF
My targets
0.5461 CHF (+0.0023)
0.5489 CHF (+0.0051)
My analysis
All elements being clearly bullish, it would be possible for traders to trade only long positions (at the time of purchase) on NZD/CHF as long as the price remains well above 0.5428 CHF. The buyers' bullish objective is set at 0.5461 CHF. A bullish break in this resistance would boost the bullish momentum. The buyers could then target the resistance located at 0.5489 CHF. If there is any crossing, the next objective would be the resistance located at 0.5529 CHF. Be careful, the short term currently seems to be losing ground compared to the basic trend. Longer time units should be analysed to identify possible overbought items that could be a sign of a possible short-term correction.
Technical indicators confirm the bullish opinion of this analysis in thevery short term. However, be careful of excessive bullish movements. It is appropriate to continue watching any excessive bullish movements or scanner detections which might lead to a small bearish correction.
Force
0
10
6.8

Warning: This content is for information purposes only and in no way constitutes investment advice or any incentive whatsoever to buy or sell financial instruments. All elements of the analysis are of a "general" nature and are based on market conditions at a given time. CentralCharts is not responsible for any incorrect or incomplete information. Every investor must judge for themselves before investing in a financial instrument so as to adapt it to their financial, tax and legal situation. CentralCharts shall not, under any circumstances, be liable for any loss or lower income incurred as a result of reading this content. Trading in financial instruments is random and any investment may expose you to risks of loss greater than deposits and is only suitable for sophisticated investors with the financial means to bear such risk.
Additional analysis
Quotes
The NZD/CHF price is 0.5438 CHF. On the day, this instrument gained +0.18% with the lowest point at 0.5416 CHF and the highest point at 0.5447 CHF. The deviation from the price is +0.41% for the low point and -0.17% for the high point.0.5416
0.5447
0.5438
A study of price movements over other periods shows the following variations:
Near a new LOW record (5 years)
Type : Bearish
Timeframe : Weekly
Near a new LOW record (1 year)
Type : Bearish
Timeframe : Weekly
Near a new LOW record (1st january)
Type : Bearish
Timeframe : Weekly
Near a new LOW record (1 month)
Type : Bearish
Timeframe : Weekly
Technical
Technical analysis of this 1H chart of NZD/CHF indicates that the overall trend is strongly bullish. 89.29% of the signals given by moving averages are bullish. The slightly bullish signals given by the short-term moving averages show a weakening of the global trend. The Central Indicators market scanner is currently detecting a bullish signal that could impact this trend:
Bullish trend reversal : adaptative moving average 20
Type : Bullish
Timeframe : 1 hour
The technical indicators are bullish. There is still some doubt about the price increase.
Central Indicators, the scanner specialised in technical indicators, has identified these signals:
Parabolic SAR indicator bullish reversal
Type : Bullish
Timeframe : 1 hour
Williams %R indicator is back over -50
Type : Bullish
Timeframe : 1 hour
The Central Patterns scanner, which studies chart patterns, resistances and supports, has identified these signals:
Near horizontal support
Type : Bullish
Timeframe : 1 hour
Support of channel is broken
Type : Bearish
Timeframe : 1 hour
The Central Candlesticks scanner which studies Japanese candlesticks did not detect anything.
ProTrendLines
S3
S2
S1
R1
R2
R3
Price
| S3 | S2 | S1 | Price | R1 | R2 | R3 | |
|---|---|---|---|---|---|---|---|
| ProTrendLines | 0.5369 | 0.5399 | 0.5428 | 0.5438 | 0.5461 | 0.5489 | 0.5529 |
| Change (%) | -1.27% | -0.72% | -0.18% | - | +0.42% | +0.94% | +1.67% |
| Change | -0.0069 | -0.0039 | -0.0010 | - | +0.0023 | +0.0051 | +0.0091 |
| Level | Major | Intermediate | Intermediate | - | Intermediate | Intermediate | Intermediate |
To determine price objectives, it is also possible to use the pivot points. Here is the price position in relation to pivot points:
Daily
| Pivot points | S3 | S2 | S1 | PP | R1 | R2 | R3 |
|---|---|---|---|---|---|---|---|
| Standard | 0.5383 | 0.5393 | 0.5411 | 0.5421 | 0.5439 | 0.5449 | 0.5467 |
| Camarilla | 0.5420 | 0.5423 | 0.5425 | 0.5428 | 0.5431 | 0.5433 | 0.5436 |
| Woodie | 0.5386 | 0.5395 | 0.5414 | 0.5423 | 0.5442 | 0.5451 | 0.5470 |
| Fibonacci | 0.5393 | 0.5404 | 0.5411 | 0.5421 | 0.5432 | 0.5439 | 0.5449 |
Weekly
| Pivot points | S3 | S2 | S1 | PP | R1 | R2 | R3 |
|---|---|---|---|---|---|---|---|
| Standard | 0.5120 | 0.5201 | 0.5280 | 0.5361 | 0.5440 | 0.5521 | 0.5600 |
| Camarilla | 0.5316 | 0.5331 | 0.5345 | 0.5360 | 0.5375 | 0.5389 | 0.5404 |
| Woodie | 0.5120 | 0.5201 | 0.5280 | 0.5361 | 0.5440 | 0.5521 | 0.5600 |
| Fibonacci | 0.5201 | 0.5262 | 0.5300 | 0.5361 | 0.5422 | 0.5460 | 0.5521 |
Monthly
| Pivot points | S3 | S2 | S1 | PP | R1 | R2 | R3 |
|---|---|---|---|---|---|---|---|
| Standard | 0.5234 | 0.5295 | 0.5340 | 0.5401 | 0.5446 | 0.5507 | 0.5552 |
| Camarilla | 0.5356 | 0.5366 | 0.5375 | 0.5385 | 0.5395 | 0.5404 | 0.5414 |
| Woodie | 0.5226 | 0.5291 | 0.5332 | 0.5397 | 0.5438 | 0.5503 | 0.5544 |
| Fibonacci | 0.5295 | 0.5336 | 0.5361 | 0.5401 | 0.5442 | 0.5467 | 0.5507 |
Numerical data
The following is the status of technical indicators and moving averages registered at the time this technical analysis was created:
Technical indicators
Moving averages
| RSI (14): | 56.00 | |
| MACD (12,26,9): | 0.0001 | |
| Directional Movement: | -0.1910 | |
| AROON (14): | -14.2857 | |
| DEMA (21): | 0.5430 | |
| Parabolic SAR (0,02-0,02-0,2): | 0.5437 | |
| Elder Ray (13): | 0.0004 | |
| Super Trend (3,10): | 0.5420 | |
| Zig ZAG (10): | 0.5434 | |
| VORTEX (21): | 1.0057 | |
| Stochastique (14,3,5): | 49.46 | |
| TEMA (21): | 0.5428 | |
| Williams %R (14): | -35.48 | |
| Chande Momentum Oscillator (20): | -0.0007 | |
| Repulse (5,40,3): | 0.2089 | |
| ROCnROLL: | 1 | |
| TRIX (15,9): | 0.0031 | |
| Courbe Coppock: | 0.30 |
| MA7: | 0.5400 | |
| MA20: | 0.5415 | |
| MA50: | 0.5410 | |
| MA100: | 0.5371 | |
| MAexp7: | 0.5430 | |
| MAexp20: | 0.5429 | |
| MAexp50: | 0.5423 | |
| MAexp100: | 0.5413 | |
| Price / MA7: | +0.70% | |
| Price / MA20: | +0.42% | |
| Price / MA50: | +0.52% | |
| Price / MA100: | +1.25% | |
| Price / MAexp7: | +0.15% | |
| Price / MAexp20: | +0.17% | |
| Price / MAexp50: | +0.28% | |
| Price / MAexp100: | +0.46% |
Quotes :
-
Real time data
-
Forex
News
The last news published on NZD/CHF at the time of the generation of this analysis was as follows: