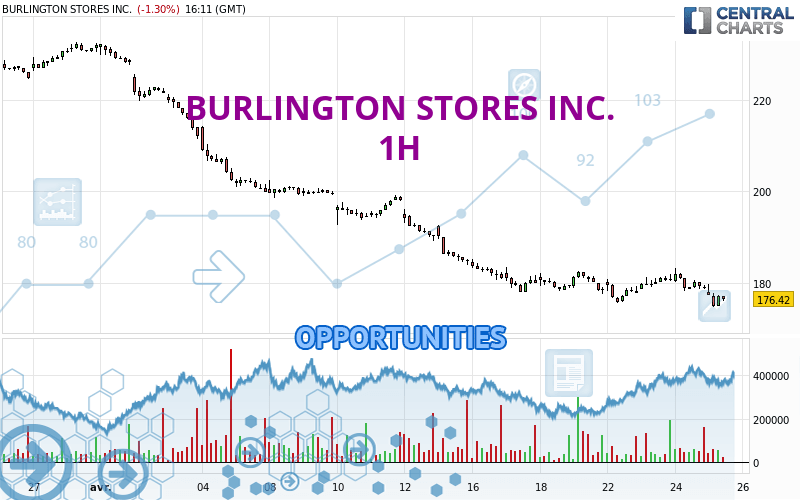
Londinia Opportunities Analyses - 04/25/2024 (GMT) BURLINGTON STORES INC. - 1H
- U.S. Stocks
- Timeframe : 1H
- - Analysis generated on
- Status : INVALID
Summary of the analysis
Trends
Short term:
Strongly bearish
Underlying:
Strongly bearish
Technical indicators
11%
61%
28%
My opinion
Bearish under 180.00 USD
My targets
167.80 USD (-4.96%)
162.79 USD (-7.79%)
My analysis
BURLINGTON STORES INC. is part of a very strong bearish trend. Traders may consider trading only short positions (for sale) as long as the price remains well below 180.00 USD. The next support located at 167.80 USD is the next bearish objective to target. A bearish break of this support would revive the bearish momentum. The bearish movement could then continue towards the next support located at 162.79 USD. Below this support, sellers could then target 139.89 USD. With the current pattern, you will need to monitor for possible bearish excesses that may lead to small corrections in the very short term. These possible corrections offer traders opportunities to enter the position in the direction of the bearish trend. Trying to profit from the purchase of these possible corrections may seem risky.
In the very short term, the general bearish sentiment is confirmed by technical indicators. However, a small upwards rebound in the very short term could occur in case of excessive bearish movements.
Force
0
10
7.7

Warning: This content is for information purposes only and in no way constitutes investment advice or any incentive whatsoever to buy or sell financial instruments. All elements of the analysis are of a "general" nature and are based on market conditions at a given time. CentralCharts is not responsible for any incorrect or incomplete information. Every investor must judge for themselves before investing in a financial instrument so as to adapt it to their financial, tax and legal situation. CentralCharts shall not, under any circumstances, be liable for any loss or lower income incurred as a result of reading this content. Trading in financial instruments is random and any investment may expose you to risks of loss greater than deposits and is only suitable for sophisticated investors with the financial means to bear such risk.
Additional analysis
Quotes
BURLINGTON STORES INC. rating 176.55 USD. On the day, this instrument lost -1.23% and was between 174.64 USD and 179.62 USD. This implies that the price is at +1.09% from its lowest and at -1.71% from its highest.174.64
179.62
176.55
A bearish gap was detected at the opening by the Central Gaps scanner. There are a lot of sellers and they have the upper hand in the very short term.
Opening Gap DOWN
Type : Bearish
Timeframe : Openning
Here is a more detailed summary of the historical variations registered by BURLINGTON STORES INC.:
New LOW record (1st january)
Type : Bearish
Timeframe : Weekly
New LOW record (1 month)
Type : Bearish
Timeframe : Weekly
Technical
Technical analysis of BURLINGTON STORES INC. in 1H shows a overall strongly bearish trend. The signals given by moving averages are 92.86% bearish. This strong bearish trend is confirmed by the strong signals currently being given by short-term moving averages. There is no crossing of moving average by the price or crossing of moving averages between themselves.
In fact, 11 technical indicators on 18 studied are currently positioned bearish. But beware of excesses. The Central Indicators scanner currently detects this:
CCI indicator is oversold : under -100
Type : Neutral
Timeframe : 1 hour
Previous candle closed under Bollinger bands
Type : Neutral
Timeframe : 1 hour
Williams %R indicator is oversold : under -80
Type : Neutral
Timeframe : 1 hour
Pivot points : price is under support 1
Type : Neutral
Timeframe : 1 hour
No signals are given by Central Patterns, a market scanner specialised in chart patterns, resistances and supports.
For a small setback in the very short term, the Central Candlesticks scanner currently notes the presence of this bearish pattern in Japanese candlesticks:
Bearish harami cross
Type : Bearish
Timeframe : 1 hour
ProTrendLines
S3
S2
S1
R1
R2
R3
Price
| S3 | S2 | S1 | Price | R1 | R2 | R3 | |
|---|---|---|---|---|---|---|---|
| ProTrendLines | 125.72 | 139.89 | 162.79 | 176.55 | 180.00 | 193.77 | 199.15 |
| Change (%) | -28.79% | -20.76% | -7.79% | - | +1.95% | +9.75% | +12.80% |
| Change | -50.83 | -36.66 | -13.76 | - | +3.45 | +17.22 | +22.60 |
| Level | Minor | Intermediate | Minor | - | Major | Major | Minor |
Attention could also be paid to pivot points to set price objectives:
Daily
| Pivot points | S3 | S2 | S1 | PP | R1 | R2 | R3 |
|---|---|---|---|---|---|---|---|
| Standard | 171.99 | 175.11 | 176.92 | 180.04 | 181.85 | 184.97 | 186.78 |
| Camarilla | 177.38 | 177.84 | 178.29 | 178.74 | 179.19 | 179.64 | 180.10 |
| Woodie | 171.35 | 174.78 | 176.28 | 179.71 | 181.21 | 184.64 | 186.14 |
| Fibonacci | 175.11 | 176.99 | 178.15 | 180.04 | 181.92 | 183.08 | 184.97 |
Weekly
| Pivot points | S3 | S2 | S1 | PP | R1 | R2 | R3 |
|---|---|---|---|---|---|---|---|
| Standard | 158.07 | 167.80 | 173.18 | 182.91 | 188.29 | 198.02 | 203.40 |
| Camarilla | 174.42 | 175.80 | 177.19 | 178.57 | 179.96 | 181.34 | 182.73 |
| Woodie | 155.91 | 166.71 | 171.02 | 181.82 | 186.13 | 196.93 | 201.24 |
| Fibonacci | 167.80 | 173.57 | 177.14 | 182.91 | 188.68 | 192.25 | 198.02 |
Monthly
| Pivot points | S3 | S2 | S1 | PP | R1 | R2 | R3 |
|---|---|---|---|---|---|---|---|
| Standard | 184.06 | 193.88 | 213.04 | 222.86 | 242.02 | 251.84 | 271.00 |
| Camarilla | 224.22 | 226.88 | 229.53 | 232.19 | 234.85 | 237.50 | 240.16 |
| Woodie | 188.72 | 196.22 | 217.70 | 225.20 | 246.68 | 254.18 | 275.66 |
| Fibonacci | 193.88 | 204.95 | 211.79 | 222.86 | 233.93 | 240.77 | 251.84 |
Numerical data
The following is the status of the technical indicators and moving averages at the time of publication of this technical analysis:
Technical indicators
Moving averages
| RSI (14): | 36.92 | |
| MACD (12,26,9): | -0.8900 | |
| Directional Movement: | -11.29 | |
| AROON (14): | -57.15 | |
| DEMA (21): | 177.66 | |
| Parabolic SAR (0,02-0,02-0,2): | 181.99 | |
| Elder Ray (13): | -2.71 | |
| Super Trend (3,10): | 180.93 | |
| Zig ZAG (10): | 176.36 | |
| VORTEX (21): | 0.9500 | |
| Stochastique (14,3,5): | 9.67 | |
| TEMA (21): | 177.99 | |
| Williams %R (14): | -72.97 | |
| Chande Momentum Oscillator (20): | -4.02 | |
| Repulse (5,40,3): | -0.3100 | |
| ROCnROLL: | 2 | |
| TRIX (15,9): | -0.0300 | |
| Courbe Coppock: | 1.39 |
| MA7: | 178.75 | |
| MA20: | 194.74 | |
| MA50: | 205.32 | |
| MA100: | 198.01 | |
| MAexp7: | 177.38 | |
| MAexp20: | 178.71 | |
| MAexp50: | 181.43 | |
| MAexp100: | 188.27 | |
| Price / MA7: | -1.23% | |
| Price / MA20: | -9.34% | |
| Price / MA50: | -14.01% | |
| Price / MA100: | -10.84% | |
| Price / MAexp7: | -0.47% | |
| Price / MAexp20: | -1.21% | |
| Price / MAexp50: | -2.69% | |
| Price / MAexp100: | -6.23% |
Quotes :
-
15 min delayed data
-
Actions NYSE
News
The last news published on BURLINGTON STORES INC. at the time of the generation of this analysis was as follows:
- Burlington Stores Kicks Off the Holiday Season with its Coat Event in Partnership with Delivering Good
- Burlington Stores Set to Join S&P MidCap 400; Envestnet to Join S&P SmallCap 600
- Burlington Stores and AdoptAClassroom.org Launch 7th Annual Fundraising Campaign with $500,000 Donation
- Burlington Stores Partners with YouthBuild USA: Empowering Young People to Reach Their Full Potential
- Thinking about trading options or stock in Burlington Stores, Occidental Petroleum, Kohl's, Tesla, or Twitter?