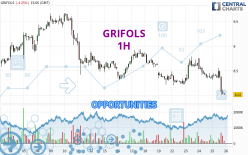
Londinia Opportunities Analyses - 04/25/2024 (GMT) GRIFOLS - 1H
| Type: | Stocks |
| Ticker: | GRF |
| ISIN: | ES0171996087 |
- Europe Stocks
- Timeframe : 1H
- - Analysis generated on
- Status : INVALID
Summary of the analysis

Additional analysis
Quotes
GRIFOLS rating 8.048 EUR. On the day, this instrument lost -3.92% and was traded between 8.006 EUR and 8.556 EUR over the period. The price is currently at +0.52% from its lowest and -5.94% from its highest.A bearish opening was detected by the Central Gaps scanner. Sellers are trying to impose a bearish trend in the very short term.
Bearish opening
Type : Bearish
Timeframe : Openning
So that you have an overall view of the price change, here is a table showing the variations over several periods:
Near a new LOW record (1 month)
Type : Bearish
Timeframe : Weekly
The Central Volumes scanner detects abnormal volumes on the asset:
Abnormal volumes
Timeframe : 50 days
Technical
Technical analysis of GRIFOLS in 1H shows a overall strongly bearish trend. 92.86% of the signals given by moving averages are bearish. This strongly bearish trend is supported by the strong bearish signals given by short-term moving averages. The Central Indicators market scanner is currently detecting a bearish signal that could impact this trend:
Moving Average bearish crossovers : MA20 & MA50
Type : Bearish
Timeframe : 1 hour
An assessment of technical indicators shows a strong bearish signal.
Caution: the Central Indicators scanner currently detects an excess:
CCI indicator is oversold : under -100
Type : Neutral
Timeframe : 1 hour
Previous candle closed under Bollinger bands
Type : Neutral
Timeframe : 1 hour
Williams %R indicator is oversold : under -80
Type : Neutral
Timeframe : 1 hour
Pivot points : price is under support 1
Type : Neutral
Timeframe : Weekly
Pivot points : price is under support 2
Type : Neutral
Timeframe : 1 hour
Central Patterns, the market scanner focusing on chart patterns, resistances and supports found these results:
Horizontal support is broken
Type : Bearish
Timeframe : 1 hour
Support of channel is broken
Type : Bearish
Timeframe : 1 hour
The Central Candlesticks scanner, specialised in Japanese candlesticks, did not identify any signals.
| S3 | S2 | S1 | Price | R1 | R2 | R3 | |
|---|---|---|---|---|---|---|---|
| ProTrendLines | 6.898 | 7.710 | 8.030 | 8.048 | 8.213 | 8.421 | 8.938 |
| Change (%) | -14.29% | -4.20% | -0.22% | - | +2.05% | +4.63% | +11.06% |
| Change | -1.150 | -0.338 | -0.018 | - | +0.165 | +0.373 | +0.890 |
| Level | Major | Minor | Major | - | Major | Intermediate | Minor |
Pivot points can also be used to set your price objectives. Here is the price situation in relation to pivot points:
| Pivot points | S3 | S2 | S1 | PP | R1 | R2 | R3 |
|---|---|---|---|---|---|---|---|
| Standard | 7.793 | 8.061 | 8.219 | 8.487 | 8.645 | 8.913 | 9.071 |
| Camarilla | 8.259 | 8.298 | 8.337 | 8.376 | 8.415 | 8.454 | 8.493 |
| Woodie | 7.737 | 8.034 | 8.163 | 8.460 | 8.589 | 8.886 | 9.015 |
| Fibonacci | 8.061 | 8.224 | 8.325 | 8.487 | 8.650 | 8.751 | 8.913 |
| Pivot points | S3 | S2 | S1 | PP | R1 | R2 | R3 |
|---|---|---|---|---|---|---|---|
| Standard | 7.344 | 7.782 | 8.064 | 8.502 | 8.784 | 9.222 | 9.504 |
| Camarilla | 8.148 | 8.214 | 8.280 | 8.346 | 8.412 | 8.478 | 8.544 |
| Woodie | 7.266 | 7.743 | 7.986 | 8.463 | 8.706 | 9.183 | 9.426 |
| Fibonacci | 7.782 | 8.057 | 8.227 | 8.502 | 8.777 | 8.947 | 9.222 |
| Pivot points | S3 | S2 | S1 | PP | R1 | R2 | R3 |
|---|---|---|---|---|---|---|---|
| Standard | 3.821 | 5.091 | 6.715 | 7.985 | 9.609 | 10.879 | 12.503 |
| Camarilla | 7.542 | 7.807 | 8.073 | 8.338 | 8.603 | 8.869 | 9.134 |
| Woodie | 3.997 | 5.180 | 6.891 | 8.074 | 9.785 | 10.968 | 12.679 |
| Fibonacci | 5.091 | 6.197 | 6.880 | 7.985 | 9.091 | 9.774 | 10.879 |
Numerical data
The following is the status of technical indicators and moving averages registered at the time this technical analysis was created:
| RSI (14): | 32.74 | |
| MACD (12,26,9): | -0.0640 | |
| Directional Movement: | -8.751 | |
| AROON (14): | -92.857 | |
| DEMA (21): | 8.302 | |
| Parabolic SAR (0,02-0,02-0,2): | 8.545 | |
| Elder Ray (13): | -0.253 | |
| Super Trend (3,10): | 8.470 | |
| Zig ZAG (10): | 8.070 | |
| VORTEX (21): | 0.7630 | |
| Stochastique (14,3,5): | 13.74 | |
| TEMA (21): | 8.244 | |
| Williams %R (14): | -96.00 | |
| Chande Momentum Oscillator (20): | -0.402 | |
| Repulse (5,40,3): | -4.5220 | |
| ROCnROLL: | 2 | |
| TRIX (15,9): | -0.0450 | |
| Courbe Coppock: | 5.93 |
| MA7: | 8.442 | |
| MA20: | 8.676 | |
| MA50: | 8.913 | |
| MA100: | 10.395 | |
| MAexp7: | 8.201 | |
| MAexp20: | 8.373 | |
| MAexp50: | 8.456 | |
| MAexp100: | 8.534 | |
| Price / MA7: | -4.67% | |
| Price / MA20: | -7.24% | |
| Price / MA50: | -9.70% | |
| Price / MA100: | -22.58% | |
| Price / MAexp7: | -1.87% | |
| Price / MAexp20: | -3.88% | |
| Price / MAexp50: | -4.82% | |
| Price / MAexp100: | -5.69% |
News
The last news published on GRIFOLS at the time of the generation of this analysis was as follows:
- Grifols 2023 Annual Report on Form 20-F filed with the SEC
- Grifols Celebrates 50 Years of Manufacturing Life-Changing Plasma-Derived Medicines for Patients at Flagship Site in Clayton, N.C.
- SHAREHOLDER ALERT: Pomerantz Law Firm Investigates Claims on Behalf of Investors of Grifols S.A. - GRFS
- SHAREHOLDER ALERT: Pomerantz Law Firm Investigates Claims on Behalf of Investors of Grifols S.A. - GRFS
- SHAREHOLDER ALERT: Pomerantz Law Firm Investigates Claims on Behalf of Investors of Grifols S.A. - GRFS