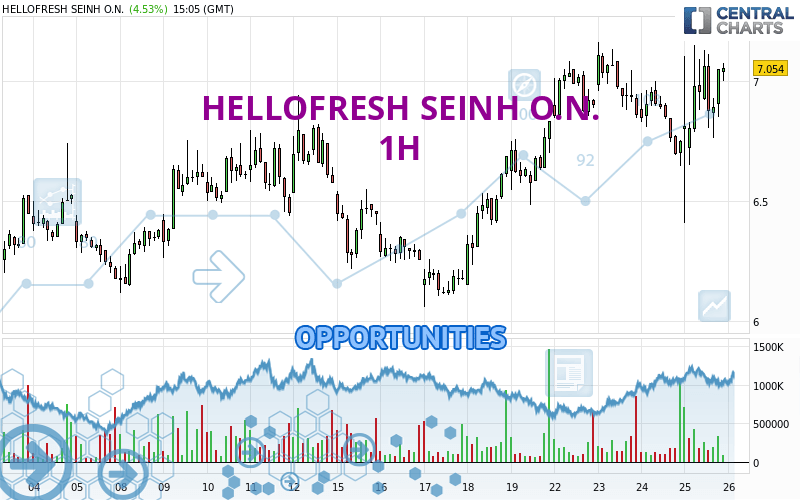
Londinia Opportunities Analyses - 04/25/2024 (GMT) HELLOFRESH SEINH O.N. - 1H
-
EUR
(-)
-
15 min delayed data - Germany Stocks
| Type: | Stocks |
| Ticker: | HFG |
| ISIN: | DE000A161408 |
- Europe Stocks
- Timeframe : 1H
- - Analysis generated on
- Status : INVALID
Summary of the analysis
Trends
Short term:
Strongly bullish
Underlying:
Strongly bullish
Technical indicators
67%
11%
22%
My opinion
Bullish above 6.938 EUR
My targets
7.160 EUR (+1.94%)
7.861 EUR (+11.92%)
My analysis
The bullish trend is currently very strong on HELLOFRESH SEINH O.N.. As long as the price remains above the support at 6.938 EUR, you could try to benefit from the boom. The first bullish objective is located at 7.160 EUR. The bullish momentum would be boosted by a break in this resistance. Buyers would then use the next resistance located at 7.861 EUR as an objective. Crossing it would then enable buyers to target 13.531 EUR. Be careful, given the powerful bullish rally underway, excesses could lead to a possible correction in the short term. If this is the case, remember that trading against the trend may be riskier. It would seem more appropriate to wait for a signal indicating reversal of the trend.
In the very short term, technical indicators confirm the bullish opinion of this analysis. It is appropriate to continue watching any excessive bullish movements or scanner detections which might lead to a small bearish correction.
Force
0
10
7.9

Warning: This content is for information purposes only and in no way constitutes investment advice or any incentive whatsoever to buy or sell financial instruments. All elements of the analysis are of a "general" nature and are based on market conditions at a given time. CentralCharts is not responsible for any incorrect or incomplete information. Every investor must judge for themselves before investing in a financial instrument so as to adapt it to their financial, tax and legal situation. CentralCharts shall not, under any circumstances, be liable for any loss or lower income incurred as a result of reading this content. Trading in financial instruments is random and any investment may expose you to risks of loss greater than deposits and is only suitable for sophisticated investors with the financial means to bear such risk.
Additional analysis
Quotes
The HELLOFRESH SEINH O.N. price is 7.024 EUR. The price has increased by +4.09% since the last closing with the lowest point at 6.410 EUR and the highest point at 7.148 EUR. The deviation from the price is +9.58% for the low point and -1.73% for the high point.6.410
7.148
7.024
A bullish opening was detected by the Central Gaps scanner. Buyers are trying to impose a bullish momentum in the very short term.
Bullish opening
Type : Bullish
Timeframe : Openning
A study of price movements over other periods shows the following variations:
Near a new HIGH record (1 month)
Type : Bullish
Timeframe : Weekly
The Central Volumes scanner detects abnormal volumes on the asset:
Abnormal volumes
Timeframe : 50 days
Technical
Technical analysis of this 1H chart of HELLOFRESH SEINH O.N. indicates that the overall trend is strongly bullish. The signals given by the moving averages are 92.86% bullish. This strong bullish trend is confirmed by the strong signals currently being given by short-term moving averages. The Central Indicators market scanner currently does not detect any result that concerns moving averages.
The technical indicators are bullish. There is still some doubt about the price increase.
Other results related to technical indicators were also found by the Central Indicators scanner:
Pivot points : price is over resistance 1
Type : Neutral
Timeframe : 1 hour
Momentum indicator is back over 0
Type : Bullish
Timeframe : 1 hour
The analysis of the price chart with Central Patterns scanners does not return any result.
The presence of a bullish Japanese candlestick pattern detected by Central Candlesticks that could cause a very short term rebound was also detected:
White morning star
Type : Bullish
Timeframe : 1 hour
ProTrendLines
S3
S2
S1
R1
R2
R3
Price
| S3 | S2 | S1 | Price | R1 | R2 | R3 | |
|---|---|---|---|---|---|---|---|
| ProTrendLines | 6.515 | 6.744 | 6.938 | 7.024 | 7.160 | 13.531 | 20.535 |
| Change (%) | -7.25% | -3.99% | -1.22% | - | +1.94% | +92.64% | +192.35% |
| Change | -0.509 | -0.280 | -0.086 | - | +0.136 | +6.507 | +13.511 |
| Level | Minor | Major | Minor | - | Intermediate | Intermediate | Minor |
Pivot points can also be used to set your price objectives. Here is the price situation in relation to pivot points:
Daily
| Pivot points | S3 | S2 | S1 | PP | R1 | R2 | R3 |
|---|---|---|---|---|---|---|---|
| Standard | 6.242 | 6.444 | 6.596 | 6.798 | 6.950 | 7.152 | 7.304 |
| Camarilla | 6.651 | 6.683 | 6.716 | 6.748 | 6.781 | 6.813 | 6.845 |
| Woodie | 6.217 | 6.432 | 6.571 | 6.786 | 6.925 | 7.140 | 7.279 |
| Fibonacci | 6.444 | 6.579 | 6.663 | 6.798 | 6.933 | 7.017 | 7.152 |
Weekly
| Pivot points | S3 | S2 | S1 | PP | R1 | R2 | R3 |
|---|---|---|---|---|---|---|---|
| Standard | 5.545 | 5.803 | 6.317 | 6.575 | 7.089 | 7.347 | 7.861 |
| Camarilla | 6.620 | 6.691 | 6.761 | 6.832 | 6.903 | 6.974 | 7.044 |
| Woodie | 5.674 | 5.867 | 6.446 | 6.639 | 7.218 | 7.411 | 7.990 |
| Fibonacci | 5.803 | 6.098 | 6.280 | 6.575 | 6.870 | 7.052 | 7.347 |
Monthly
| Pivot points | S3 | S2 | S1 | PP | R1 | R2 | R3 |
|---|---|---|---|---|---|---|---|
| Standard | -2.602 | 1.764 | 4.178 | 8.544 | 10.958 | 15.324 | 17.738 |
| Camarilla | 4.728 | 5.349 | 5.971 | 6.592 | 7.214 | 7.835 | 8.457 |
| Woodie | -3.578 | 1.276 | 3.202 | 8.056 | 9.982 | 14.836 | 16.762 |
| Fibonacci | 1.764 | 4.354 | 5.954 | 8.544 | 11.134 | 12.734 | 15.324 |
Numerical data
The following are the details of the technical indicators and moving averages that were collected to generate this technical analysis:
Technical indicators
Moving averages
| RSI (14): | 56.20 | |
| MACD (12,26,9): | 0.0270 | |
| Directional Movement: | 13.390 | |
| AROON (14): | 14.286 | |
| DEMA (21): | 6.938 | |
| Parabolic SAR (0,02-0,02-0,2): | 6.546 | |
| Elder Ray (13): | 0.030 | |
| Super Trend (3,10): | 6.464 | |
| Zig ZAG (10): | 7.024 | |
| VORTEX (21): | 0.9660 | |
| Stochastique (14,3,5): | 69.92 | |
| TEMA (21): | 6.916 | |
| Williams %R (14): | -16.80 | |
| Chande Momentum Oscillator (20): | 0.132 | |
| Repulse (5,40,3): | 2.8000 | |
| ROCnROLL: | 1 | |
| TRIX (15,9): | 0.0370 | |
| Courbe Coppock: | 0.68 |
| MA7: | 6.750 | |
| MA20: | 6.564 | |
| MA50: | 8.566 | |
| MA100: | 11.069 | |
| MAexp7: | 6.963 | |
| MAexp20: | 6.894 | |
| MAexp50: | 6.807 | |
| MAexp100: | 6.708 | |
| Price / MA7: | +4.06% | |
| Price / MA20: | +7.01% | |
| Price / MA50: | -18.00% | |
| Price / MA100: | -36.54% | |
| Price / MAexp7: | +0.88% | |
| Price / MAexp20: | +1.89% | |
| Price / MAexp50: | +3.19% | |
| Price / MAexp100: | +4.71% |
Quotes :
-
15 min delayed data
-
Actions Allemagne
News
The latest news and videos published on HELLOFRESH SEINH O.N. at the time of the analysis were as follows:
- EQS-News: HelloFresh SE reports quarterly revenue of approx. €2.07 bn Ready-to-Eat product category growing quickly and expanding to further countries
- EQS-News: HelloFresh SE reports €7.6bn consolidated revenue for the FY 2023 and returns to positive free cash flow
- EQS-Adhoc: HelloFresh SE met outlook for the fiscal year 2023, provides outlook for the fiscal year 2024 and removes its midterm targets
- EQS-Adhoc: HelloFresh SE narrows revenue growth outlook and lowers adjusted EBITDA (“AEBITDA”) outlook for the fiscal year 2023
- EQS-News: Q3 2023: HelloFresh records highest average order value to date, following investment into significant product improvements