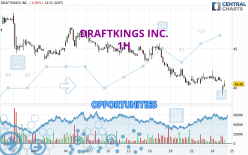
Londinia Opportunities Analyses - 04/25/2024 (GMT) DRAFTKINGS INC. - 1H
- U.S. Stocks
- Timeframe : 1H
- - Analysis generated on
- Status : INVALID
Summary of the analysis
Trends
Short term:
Strongly bearish
Underlying:
Strongly bearish
Technical indicators
11%
67%
22%
My opinion
Bearish under 42.20 USD
My targets
38.70 USD (-4.63%)
35.93 USD (-11.46%)
My analysis
DRAFTKINGS INC. is part of a very strong bearish trend. Traders may consider trading only short positions (for sale) as long as the price remains well below 42.20 USD. The next support located at 38.70 USD is the next bearish objective to target. A bearish break of this support would revive the bearish momentum. The bearish movement could then continue towards the next support located at 35.93 USD. Below this support, sellers could then target 32.18 USD. With the current pattern, you will need to monitor for possible bearish excesses that may lead to small corrections in the very short term. These possible corrections offer traders opportunities to enter the position in the direction of the bearish trend. Trying to profit from the purchase of these possible corrections may seem risky.
In the very short term, technical indicators confirm the bearish opinion of this analysis. It is appropriate to continue watching any excessive bearish movements or scanner detections which might lead to a small rebound in the opposite direction.
Force
0
10
7.9

Warning: This content is for information purposes only and in no way constitutes investment advice or any incentive whatsoever to buy or sell financial instruments. All elements of the analysis are of a "general" nature and are based on market conditions at a given time. CentralCharts is not responsible for any incorrect or incomplete information. Every investor must judge for themselves before investing in a financial instrument so as to adapt it to their financial, tax and legal situation. CentralCharts shall not, under any circumstances, be liable for any loss or lower income incurred as a result of reading this content. Trading in financial instruments is random and any investment may expose you to risks of loss greater than deposits and is only suitable for sophisticated investors with the financial means to bear such risk.
Additional analysis
Quotes
DRAFTKINGS INC. rating 40.58 USD. On the day, this instrument lost -0.66% and was between 39.04 USD and 40.59 USD. This implies that the price is at +3.94% from its lowest and at -0.02% from its highest.39.04
40.59
40.58
The Central Gaps scanner detects the formation of a bearish gap marking the strong presence of sellers ahead of buyers at the opening. This formed a quotation gap.
Opening Gap DOWN
Type : Bearish
Timeframe : Openning
So that you have an overall view of the price change, here is a table showing the variations over several periods:
Near a new LOW record (1 month)
Type : Bearish
Timeframe : Weekly
Technical
Technical analysis of this 1H chart of DRAFTKINGS INC. indicates that the overall trend is strongly bearish. The signals given by moving averages are 92.86% bearish. This strong bearish trend is confirmed by the strong signals currently being given by short-term moving averages. The Central Indicators market scanner currently does not detect any result that concerns moving averages.
Technical indicators are bearish. There is still some doubt about the decline in the price.
Caution: the Central Indicators scanner currently detects an excess:
CCI indicator is oversold : under -100
Type : Neutral
Timeframe : 1 hour
Pivot points : price is under support 1
Type : Neutral
Timeframe : 1 hour
MACD crosses DOWN its Moving Average
Type : Bearish
Timeframe : 1 hour
The Central Patterns scanner, which studies chart patterns, resistances and supports, has identified these signals:
Near horizontal resistance
Type : Bearish
Timeframe : 1 hour
Near support of channel
Type : Bullish
Timeframe : 1 hour
The Central Candlesticks scanner currently notes the presence of this pattern in Japanese candlesticks that could mark the end of the short-term trend currently underway:
White hanging man / hammer
Type : Neutral
Timeframe : 1 hour
ProTrendLines
S3
S2
S1
R1
R2
R3
Price
| S3 | S2 | S1 | Price | R1 | R2 | R3 | |
|---|---|---|---|---|---|---|---|
| ProTrendLines | 26.30 | 32.18 | 35.93 | 40.58 | 40.67 | 44.71 | 45.72 |
| Change (%) | -35.19% | -20.70% | -11.46% | - | +0.22% | +10.18% | +12.67% |
| Change | -14.28 | -8.40 | -4.65 | - | +0.09 | +4.13 | +5.14 |
| Level | Intermediate | Intermediate | Minor | - | Major | Major | Intermediate |
Pivot points can also be used to set your price objectives. Here is the price situation in relation to pivot points:
Daily
| Pivot points | S3 | S2 | S1 | PP | R1 | R2 | R3 |
|---|---|---|---|---|---|---|---|
| Standard | 38.74 | 39.72 | 40.28 | 41.26 | 41.82 | 42.80 | 43.36 |
| Camarilla | 40.43 | 40.57 | 40.71 | 40.85 | 40.99 | 41.13 | 41.27 |
| Woodie | 38.54 | 39.62 | 40.08 | 41.16 | 41.62 | 42.70 | 43.16 |
| Fibonacci | 39.72 | 40.31 | 40.67 | 41.26 | 41.85 | 42.21 | 42.80 |
Weekly
| Pivot points | S3 | S2 | S1 | PP | R1 | R2 | R3 |
|---|---|---|---|---|---|---|---|
| Standard | 33.23 | 36.73 | 38.70 | 42.20 | 44.17 | 47.67 | 49.64 |
| Camarilla | 39.18 | 39.68 | 40.18 | 40.68 | 41.18 | 41.68 | 42.18 |
| Woodie | 32.48 | 36.35 | 37.95 | 41.82 | 43.42 | 47.29 | 48.89 |
| Fibonacci | 36.73 | 38.82 | 40.11 | 42.20 | 44.29 | 45.58 | 47.67 |
Monthly
| Pivot points | S3 | S2 | S1 | PP | R1 | R2 | R3 |
|---|---|---|---|---|---|---|---|
| Standard | 31.78 | 36.17 | 40.79 | 45.18 | 49.80 | 54.19 | 58.81 |
| Camarilla | 42.93 | 43.76 | 44.58 | 45.41 | 46.24 | 47.06 | 47.89 |
| Woodie | 31.90 | 36.23 | 40.91 | 45.24 | 49.92 | 54.25 | 58.93 |
| Fibonacci | 36.17 | 39.61 | 41.74 | 45.18 | 48.62 | 50.75 | 54.19 |
Numerical data
The following are the details of the technical indicators and moving averages that were collected to generate this technical analysis:
Technical indicators
Moving averages
| RSI (14): | 35.36 | |
| MACD (12,26,9): | -0.2900 | |
| Directional Movement: | -18.47 | |
| AROON (14): | -50.00 | |
| DEMA (21): | 40.68 | |
| Parabolic SAR (0,02-0,02-0,2): | 41.97 | |
| Elder Ray (13): | -1.32 | |
| Super Trend (3,10): | 41.51 | |
| Zig ZAG (10): | 40.20 | |
| VORTEX (21): | 0.8600 | |
| Stochastique (14,3,5): | 24.08 | |
| TEMA (21): | 40.87 | |
| Williams %R (14): | -66.46 | |
| Chande Momentum Oscillator (20): | -1.01 | |
| Repulse (5,40,3): | 1.4800 | |
| ROCnROLL: | 2 | |
| TRIX (15,9): | -0.0900 | |
| Courbe Coppock: | 0.38 |
| MA7: | 41.05 | |
| MA20: | 43.68 | |
| MA50: | 43.51 | |
| MA100: | 40.32 | |
| MAexp7: | 40.70 | |
| MAexp20: | 41.09 | |
| MAexp50: | 41.92 | |
| MAexp100: | 42.92 | |
| Price / MA7: | -1.14% | |
| Price / MA20: | -7.10% | |
| Price / MA50: | -6.73% | |
| Price / MA100: | +0.64% | |
| Price / MAexp7: | -0.29% | |
| Price / MAexp20: | -1.24% | |
| Price / MAexp50: | -3.20% | |
| Price / MAexp100: | -5.45% |
Quotes :
-
15 min delayed data
-
Actions NASDAQ
News
The latest news and videos published on DRAFTKINGS INC. at the time of the analysis were as follows:
- Lori Kalani to Join DraftKings as First Chief Responsible Gaming Officer
- DraftKings to Release First Quarter 2024 Results on May 2, 2024 and Host Conference Call on May 3, 2024
- DraftKings and Kindbridge Behavioral Health Expand Program That Provides Treatment Resources for Individuals Experiencing Potential Indications of Problem Gaming
- DraftKings Announces Leadership Changes to Increase Focus on Operational Efficiencies
- DraftKings Launches “My Stat Sheet” – A New Tool to Promote Responsible Gaming