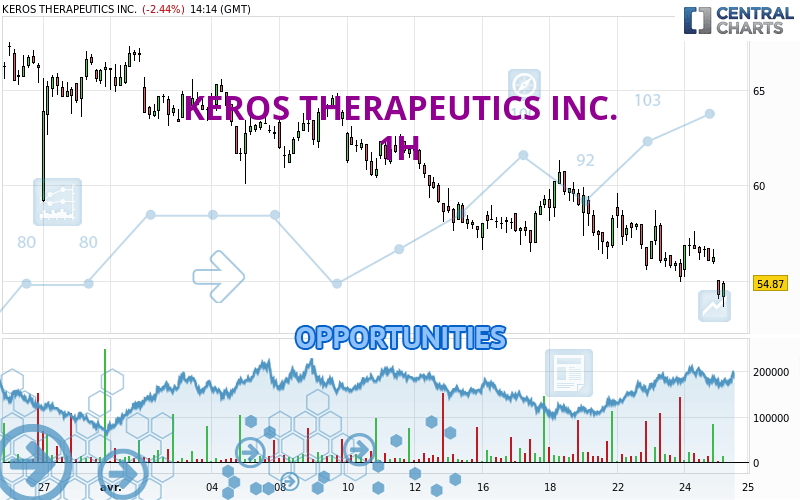
Londinia Opportunities Analyses - 04/25/2024 (GMT) KEROS THERAPEUTICS INC. - 1H
- U.S. Stocks
- Timeframe : 1H
- - Analysis generated on
- Status : INVALID
Summary of the analysis
Trends
Short term:
Strongly bearish
Underlying:
Strongly bearish
Technical indicators
6%
83%
11%
My opinion
Bearish under 54.93 USD
My targets
51.08 USD (-4.91%)
50.66 USD (-5.69%)
My analysis
All elements being clearly bearish, it would be possible for traders to trade only short positions (for sale) on KEROS THERAPEUTICS INC. as long as the price remains well below 54.93 USD. The sellers' bearish objective is set at 51.08 USD. A bearish break of this support would revive the bearish momentum. The sellers could then target the support located at 50.66 USD. In case of crossing, the next objective would be the support located at 42.33 USD. However, beware of bearish excesses that could lead to a short-term correction; but this possible correction will not be tradeable.
In the very short term, the general bearish sentiment is confirmed by technical indicators. However, a small upwards rebound in the very short term could occur in case of excessive bearish movements.
Force
0
10
8.6

Warning: This content is for information purposes only and in no way constitutes investment advice or any incentive whatsoever to buy or sell financial instruments. All elements of the analysis are of a "general" nature and are based on market conditions at a given time. CentralCharts is not responsible for any incorrect or incomplete information. Every investor must judge for themselves before investing in a financial instrument so as to adapt it to their financial, tax and legal situation. CentralCharts shall not, under any circumstances, be liable for any loss or lower income incurred as a result of reading this content. Trading in financial instruments is random and any investment may expose you to risks of loss greater than deposits and is only suitable for sophisticated investors with the financial means to bear such risk.
Additional analysis
Quotes
The KEROS THERAPEUTICS INC. rating is 53.72 USD. On the day, this instrument lost -4.48% and was between 53.63 USD and 55.05 USD. This implies that the price is at +0.17% from its lowest and at -2.42% from its highest.53.63
55.05
53.72
A bearish gap was detected at the opening by the Central Gaps scanner. There are a lot of sellers and they have the upper hand in the very short term.
Opening Gap DOWN
Type : Bearish
Timeframe : Openning
So that you have an overall view of the price change, here is a table showing the variations over several periods:
Near a new LOW record (1 month)
Type : Bearish
Timeframe : Weekly
Technical
A technical analysis in 1H of this KEROS THERAPEUTICS INC. chart shows a sharp bearish trend. The signals given by moving averages are 92.86% bearish. This strong bearish trend is confirmed by the strong signals currently being given by short-term moving averages. The Central Indicators market scanner currently does not detect any result that concerns moving averages.
An assessment of technical indicators shows a strong bearish signal.
But beware of excesses. The Central Indicators scanner currently detects this:
CCI indicator is oversold : under -100
Type : Neutral
Timeframe : 1 hour
Williams %R indicator is oversold : under -80
Type : Neutral
Timeframe : 1 hour
Pivot points : price is under support 1
Type : Neutral
Timeframe : 1 hour
MACD crosses DOWN its Moving Average
Type : Bearish
Timeframe : 1 hour
Price is back under the pivot point
Type : Bearish
Timeframe : Weekly
The analysis of the price chart with Central Patterns scanners does not return any result.
The Central Candlesticks scanner which studies Japanese candlesticks did not detect anything.
ProTrendLines
S3
S2
S1
R1
R2
R3
Price
| S3 | S2 | S1 | Price | R1 | R2 | R3 | |
|---|---|---|---|---|---|---|---|
| ProTrendLines | 36.64 | 42.33 | 51.08 | 53.72 | 54.93 | 56.56 | 59.32 |
| Change (%) | -31.79% | -21.20% | -4.91% | - | +2.25% | +5.29% | +10.42% |
| Change | -17.08 | -11.39 | -2.64 | - | +1.21 | +2.84 | +5.60 |
| Level | Intermediate | Intermediate | Major | - | Intermediate | Minor | Intermediate |
To determine price objectives, it is also possible to use the pivot points. Here is the price position in relation to pivot points:
Daily
| Pivot points | S3 | S2 | S1 | PP | R1 | R2 | R3 |
|---|---|---|---|---|---|---|---|
| Standard | 52.71 | 53.96 | 55.10 | 56.35 | 57.49 | 58.74 | 59.88 |
| Camarilla | 55.58 | 55.80 | 56.02 | 56.24 | 56.46 | 56.68 | 56.90 |
| Woodie | 52.66 | 53.93 | 55.05 | 56.32 | 57.44 | 58.71 | 59.83 |
| Fibonacci | 53.96 | 54.87 | 55.44 | 56.35 | 57.26 | 57.83 | 58.74 |
Weekly
| Pivot points | S3 | S2 | S1 | PP | R1 | R2 | R3 |
|---|---|---|---|---|---|---|---|
| Standard | 50.66 | 53.41 | 55.84 | 58.59 | 61.02 | 63.77 | 66.20 |
| Camarilla | 56.86 | 57.33 | 57.81 | 58.28 | 58.76 | 59.23 | 59.71 |
| Woodie | 50.51 | 53.33 | 55.69 | 58.51 | 60.87 | 63.69 | 66.05 |
| Fibonacci | 53.41 | 55.39 | 56.61 | 58.59 | 60.57 | 61.79 | 63.77 |
Monthly
| Pivot points | S3 | S2 | S1 | PP | R1 | R2 | R3 |
|---|---|---|---|---|---|---|---|
| Standard | 47.67 | 53.41 | 59.80 | 65.54 | 71.93 | 77.67 | 84.06 |
| Camarilla | 62.86 | 63.98 | 65.09 | 66.20 | 67.31 | 68.42 | 69.54 |
| Woodie | 48.01 | 53.57 | 60.14 | 65.70 | 72.27 | 77.83 | 84.40 |
| Fibonacci | 53.41 | 58.04 | 60.90 | 65.54 | 70.17 | 73.03 | 77.67 |
Numerical data
The following is the status of technical indicators and moving averages registered at the time this technical analysis was created:
Technical indicators
Moving averages
| RSI (14): | 34.66 | |
| MACD (12,26,9): | -0.6300 | |
| Directional Movement: | -16.43 | |
| AROON (14): | -92.86 | |
| DEMA (21): | 55.66 | |
| Parabolic SAR (0,02-0,02-0,2): | 57.41 | |
| Elder Ray (13): | -1.61 | |
| Super Trend (3,10): | 57.94 | |
| Zig ZAG (10): | 54.13 | |
| VORTEX (21): | 0.8400 | |
| Stochastique (14,3,5): | 23.37 | |
| TEMA (21): | 55.60 | |
| Williams %R (14): | -93.72 | |
| Chande Momentum Oscillator (20): | -1.68 | |
| Repulse (5,40,3): | -1.9700 | |
| ROCnROLL: | 2 | |
| TRIX (15,9): | -0.1400 | |
| Courbe Coppock: | 3.60 |
| MA7: | 56.89 | |
| MA20: | 60.38 | |
| MA50: | 63.46 | |
| MA100: | 54.50 | |
| MAexp7: | 55.90 | |
| MAexp20: | 56.51 | |
| MAexp50: | 57.68 | |
| MAexp100: | 59.38 | |
| Price / MA7: | -5.57% | |
| Price / MA20: | -11.03% | |
| Price / MA50: | -15.35% | |
| Price / MA100: | -1.43% | |
| Price / MAexp7: | -3.90% | |
| Price / MAexp20: | -4.94% | |
| Price / MAexp50: | -6.87% | |
| Price / MAexp100: | -9.53% |
Quotes :
-
15 min delayed data
-
Actions NASDAQ
News
The last news published on KEROS THERAPEUTICS INC. at the time of the generation of this analysis was as follows:
- Keros Therapeutics Announces U.S. FDA Fast Track Designation for KER-050 in Lower-Risk Myelodysplastic Syndromes
- Keros Therapeutics to Present at Leerink Partners 2024 Global Biopharma Conference
- Keros Therapeutics Reports Recent Business Highlights and Fourth Quarter and Full Year 2023 Financial Results
- Keros Therapeutics To Present at Pulmonary Vascular Research Institute 2024 Annual Congress
- Keros Therapeutics Announces Closing of Upsized Public Offering of Common Stock