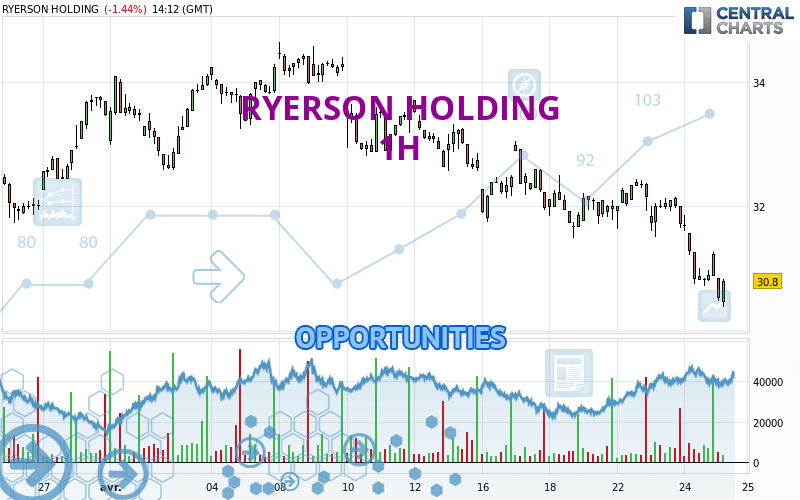
Londinia Opportunities Analyses - 04/25/2024 (GMT) RYERSON HOLDING - 1H
- U.S. Stocks
- Timeframe : 1H
- - Analysis generated on
- Status : INVALID
Summary of the analysis
Trends
Short term:
Strongly bearish
Underlying:
Strongly bearish
Technical indicators
6%
78%
17%
My opinion
Bearish under 31.02 USD
My targets
29.38 USD (-3.59%)
27.71 USD (-9.06%)
My analysis
All elements being clearly bearish, it would be possible for traders to trade only short positions (for sale) on RYERSON HOLDING as long as the price remains well below 31.02 USD. The sellers' bearish objective is set at 29.38 USD. A bearish break of this support would revive the bearish momentum. The sellers could then target the support located at 27.71 USD. In case of crossing, the next objective would be the support located at 26.16 USD. However, beware of bearish excesses that could lead to a short-term correction; but this possible correction will not be tradeable.
Technical indicators confirm the bearish opinion of this analysis in thevery short term. However, be careful of excessive bearish movements. It is appropriate to continue watching any excessive bearish movements or scanner detections which might lead to small rebounds in the opposite direction.
Force
0
10
8.4

Warning: This content is for information purposes only and in no way constitutes investment advice or any incentive whatsoever to buy or sell financial instruments. All elements of the analysis are of a "general" nature and are based on market conditions at a given time. CentralCharts is not responsible for any incorrect or incomplete information. Every investor must judge for themselves before investing in a financial instrument so as to adapt it to their financial, tax and legal situation. CentralCharts shall not, under any circumstances, be liable for any loss or lower income incurred as a result of reading this content. Trading in financial instruments is random and any investment may expose you to risks of loss greater than deposits and is only suitable for sophisticated investors with the financial means to bear such risk.
Additional analysis
Quotes
RYERSON HOLDING rating 30.47 USD. On the day, this instrument lost -2.50% and was traded between 30.38 USD and 30.85 USD over the period. The price is currently at +0.30% from its lowest and -1.23% from its highest.30.38
30.85
30.47
The Central Gaps scanner detects a bearish opening. A small advantage for sellers in the very short term.
Bearish opening
Type : Bearish
Timeframe : Openning
A study of price movements over other periods shows the following variations:
Near a new LOW record (1st january)
Type : Bearish
Timeframe : Weekly
New LOW record (1 month)
Type : Bearish
Timeframe : Weekly
Technical
Technical analysis of this 1H chart of RYERSON HOLDING indicates that the overall trend is strongly bearish. 92.86% of the signals given by moving averages are bearish. This strongly bearish trend is supported by the strong bearish signals given by short-term moving averages. The Central Indicators market scanner currently does not detect any result that concerns moving averages.
In fact, according to the parameters integrated into the Central Analyzer system, 14 technical indicators out of 18 analysed are currently bearish. Caution: the Central Indicators scanner currently detects an excess:
CCI indicator is oversold : under -100
Type : Neutral
Timeframe : 1 hour
Williams %R indicator is oversold : under -80
Type : Neutral
Timeframe : 1 hour
Pivot points : price is under support 1
Type : Neutral
Timeframe : 1 hour
No signals are given by Central Patterns, a market scanner specialised in chart patterns, resistances and supports.
From the Japanese candlestick perspective, the Central Candlesticks scanner notes the presence of these results that could impact the short-term trend:
Bullish doji star
Type : Bullish
Timeframe : 1 hour
Downside gap
Type : Bearish
Timeframe : 1 hour
ProTrendLines
S3
S2
S1
R1
R2
R3
Price
| S3 | S2 | S1 | Price | R1 | R2 | R3 | |
|---|---|---|---|---|---|---|---|
| ProTrendLines | 26.16 | 27.71 | 30.45 | 30.47 | 31.02 | 31.79 | 32.46 |
| Change (%) | -14.15% | -9.06% | -0.07% | - | +1.81% | +4.33% | +6.53% |
| Change | -4.31 | -2.76 | -0.02 | - | +0.55 | +1.32 | +1.99 |
| Level | Major | Minor | Major | - | Minor | Intermediate | Intermediate |
To determine price objectives, it is also possible to use the pivot points. Here is the price position in relation to pivot points:
Daily
| Pivot points | S3 | S2 | S1 | PP | R1 | R2 | R3 |
|---|---|---|---|---|---|---|---|
| Standard | 29.55 | 30.14 | 30.69 | 31.28 | 31.83 | 32.42 | 32.97 |
| Camarilla | 30.94 | 31.04 | 31.15 | 31.25 | 31.36 | 31.46 | 31.56 |
| Woodie | 29.54 | 30.13 | 30.68 | 31.27 | 31.82 | 32.41 | 32.96 |
| Fibonacci | 30.14 | 30.57 | 30.84 | 31.28 | 31.71 | 31.98 | 32.42 |
Weekly
| Pivot points | S3 | S2 | S1 | PP | R1 | R2 | R3 |
|---|---|---|---|---|---|---|---|
| Standard | 29.38 | 30.43 | 31.22 | 32.27 | 33.06 | 34.11 | 34.90 |
| Camarilla | 31.49 | 31.66 | 31.83 | 32.00 | 32.17 | 32.34 | 32.51 |
| Woodie | 29.24 | 30.37 | 31.08 | 32.21 | 32.92 | 34.05 | 34.76 |
| Fibonacci | 30.43 | 31.14 | 31.57 | 32.27 | 32.98 | 33.41 | 34.11 |
Monthly
| Pivot points | S3 | S2 | S1 | PP | R1 | R2 | R3 |
|---|---|---|---|---|---|---|---|
| Standard | 27.35 | 28.69 | 31.10 | 32.44 | 34.85 | 36.19 | 38.60 |
| Camarilla | 32.47 | 32.81 | 33.16 | 33.50 | 33.84 | 34.19 | 34.53 |
| Woodie | 27.88 | 28.96 | 31.63 | 32.71 | 35.38 | 36.46 | 39.13 |
| Fibonacci | 28.69 | 30.13 | 31.01 | 32.44 | 33.88 | 34.76 | 36.19 |
Numerical data
The following is the status of technical indicators and moving averages registered at the time this technical analysis was created:
Technical indicators
Moving averages
| RSI (14): | 29.62 | |
| MACD (12,26,9): | -0.4000 | |
| Directional Movement: | -23.64 | |
| AROON (14): | -71.43 | |
| DEMA (21): | 30.87 | |
| Parabolic SAR (0,02-0,02-0,2): | 31.47 | |
| Elder Ray (13): | -0.71 | |
| Super Trend (3,10): | 31.38 | |
| Zig ZAG (10): | 30.40 | |
| VORTEX (21): | 0.6300 | |
| Stochastique (14,3,5): | 13.21 | |
| TEMA (21): | 30.67 | |
| Williams %R (14): | -98.88 | |
| Chande Momentum Oscillator (20): | -1.65 | |
| Repulse (5,40,3): | -0.7000 | |
| ROCnROLL: | 2 | |
| TRIX (15,9): | -0.1200 | |
| Courbe Coppock: | 7.82 |
| MA7: | 31.62 | |
| MA20: | 32.80 | |
| MA50: | 32.35 | |
| MA100: | 32.61 | |
| MAexp7: | 30.87 | |
| MAexp20: | 31.46 | |
| MAexp50: | 31.89 | |
| MAexp100: | 32.28 | |
| Price / MA7: | -3.64% | |
| Price / MA20: | -7.10% | |
| Price / MA50: | -5.81% | |
| Price / MA100: | -6.56% | |
| Price / MAexp7: | -1.30% | |
| Price / MAexp20: | -3.15% | |
| Price / MAexp50: | -4.45% | |
| Price / MAexp100: | -5.61% |
Quotes :
-
15 min delayed data
-
Actions NYSE
News
Don't forget to follow the news on RYERSON HOLDING. At the time of publication of this analysis, the latest news was as follows:
- Ryerson to Host Earnings Call on Wednesday, May 1st, to Discuss First Quarter 2024 Results
- Ryerson Reports Fourth Quarter and Full Year 2023 Results
- Ryerson to Host Earnings Call on Thursday, February 22nd to Discuss Fourth Quarter and Full-Year 2023 Results
- Ryerson Acquires Hudson Tool Steel Corporation
- Ryerson Acquires TSA Processing