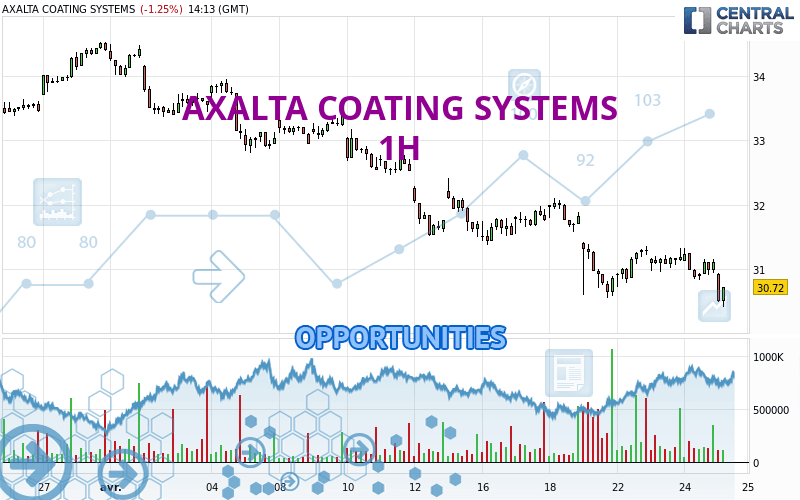
Londinia Opportunities Analyses - 04/25/2024 (GMT) AXALTA COATING SYSTEMS - 1H
| Type: | Stocks |
| Ticker: | AXTA |
| ISIN: | BMG0750C1082 |
- U.S. Stocks
- Timeframe : 1H
- - Analysis generated on
- Status : INVALID
Summary of the analysis

Additional analysis
Quotes
AXALTA COATING SYSTEMS rating 30.58 USD. On the day, this instrument lost -1.70% with the lowest point at 30.41 USD and the highest point at 30.94 USD. The deviation from the price is +0.56% for the low point and -1.16% for the high point.A bearish opening was detected by the Central Gaps scanner. Sellers are trying to impose a bearish trend in the very short term.
Bearish opening
Type : Bearish
Timeframe : Openning
A study of price movements over other periods shows the following variations:
Near a new LOW record (1st january)
Type : Bearish
Timeframe : Weekly
Near a new LOW record (1 month)
Type : Bearish
Timeframe : Weekly
Technical
Technical analysis of AXALTA COATING SYSTEMS in 1H shows a overall strongly bearish trend. The signals given by moving averages are 92.86% bearish. This strong bearish trend is confirmed by the strong signals currently being given by short-term moving averages. The Central Indicators market scanner is currently detecting a bearish signal that could impact this trend:
Bearish trend reversal : Moving Average 20
Type : Bearish
Timeframe : 1 hour
The probability of a further decline is high given the direction of the technical indicators.
But beware of excesses. The Central Indicators scanner currently detects this:
CCI indicator is oversold : under -100
Type : Neutral
Timeframe : 1 hour
Williams %R indicator is oversold : under -80
Type : Neutral
Timeframe : 1 hour
Pivot points : price is under support 3
Type : Neutral
Timeframe : 1 hour
MACD crosses DOWN its Moving Average
Type : Bearish
Timeframe : 1 hour
Parabolic SAR indicator bearish reversal
Type : Bearish
Timeframe : 1 hour
Momentum indicator is back under 0
Type : Bearish
Timeframe : 1 hour
The Central Patterns scanner, which studies chart patterns, resistances and supports, has identified this signal:
Horizontal support is broken
Type : Bearish
Timeframe : 1 hour
No result was found by the Central Candlesticks scanner on Japanese candlesticks.
| S3 | S2 | S1 | Price | R1 | R2 | R3 | |
|---|---|---|---|---|---|---|---|
| ProTrendLines | 25.42 | 28.05 | 30.55 | 30.58 | 31.02 | 31.36 | 32.11 |
| Change (%) | -16.87% | -8.27% | -0.10% | - | +1.44% | +2.55% | +5.00% |
| Change | -5.16 | -2.53 | -0.03 | - | +0.44 | +0.78 | +1.53 |
| Level | Major | Major | Major | - | Major | Intermediate | Minor |
To determine price objectives, it is also possible to use the pivot points. Here is the price position in relation to pivot points:
| Pivot points | S3 | S2 | S1 | PP | R1 | R2 | R3 |
|---|---|---|---|---|---|---|---|
| Standard | 30.35 | 30.59 | 30.85 | 31.09 | 31.35 | 31.59 | 31.85 |
| Camarilla | 30.97 | 31.02 | 31.06 | 31.11 | 31.16 | 31.20 | 31.25 |
| Woodie | 30.36 | 30.60 | 30.86 | 31.10 | 31.36 | 31.60 | 31.86 |
| Fibonacci | 30.59 | 30.78 | 30.90 | 31.09 | 31.28 | 31.40 | 31.59 |
| Pivot points | S3 | S2 | S1 | PP | R1 | R2 | R3 |
|---|---|---|---|---|---|---|---|
| Standard | 28.27 | 29.41 | 30.14 | 31.28 | 32.01 | 33.15 | 33.88 |
| Camarilla | 30.36 | 30.53 | 30.70 | 30.87 | 31.04 | 31.21 | 31.38 |
| Woodie | 28.07 | 29.31 | 29.94 | 31.18 | 31.81 | 33.05 | 33.68 |
| Fibonacci | 29.41 | 30.12 | 30.57 | 31.28 | 31.99 | 32.44 | 33.15 |
| Pivot points | S3 | S2 | S1 | PP | R1 | R2 | R3 |
|---|---|---|---|---|---|---|---|
| Standard | 30.64 | 31.44 | 32.92 | 33.72 | 35.20 | 36.00 | 37.48 |
| Camarilla | 33.76 | 33.97 | 34.18 | 34.39 | 34.60 | 34.81 | 35.02 |
| Woodie | 30.97 | 31.61 | 33.25 | 33.89 | 35.53 | 36.17 | 37.81 |
| Fibonacci | 31.44 | 32.31 | 32.85 | 33.72 | 34.59 | 35.13 | 36.00 |
Numerical data
The following is the status of technical indicators and moving averages registered at the time this technical analysis was created:
| RSI (14): | 34.60 | |
| MACD (12,26,9): | -0.1300 | |
| Directional Movement: | -18.79 | |
| AROON (14): | -50.00 | |
| DEMA (21): | 30.89 | |
| Parabolic SAR (0,02-0,02-0,2): | 31.34 | |
| Elder Ray (13): | -0.46 | |
| Super Trend (3,10): | 31.44 | |
| Zig ZAG (10): | 30.53 | |
| VORTEX (21): | 0.8500 | |
| Stochastique (14,3,5): | 28.00 | |
| TEMA (21): | 30.91 | |
| Williams %R (14): | -86.96 | |
| Chande Momentum Oscillator (20): | -0.62 | |
| Repulse (5,40,3): | -1.3300 | |
| ROCnROLL: | 2 | |
| TRIX (15,9): | -0.0500 | |
| Courbe Coppock: | 1.30 |
| MA7: | 31.22 | |
| MA20: | 32.36 | |
| MA50: | 32.59 | |
| MA100: | 32.72 | |
| MAexp7: | 30.83 | |
| MAexp20: | 31.07 | |
| MAexp50: | 31.37 | |
| MAexp100: | 31.84 | |
| Price / MA7: | -2.05% | |
| Price / MA20: | -5.50% | |
| Price / MA50: | -6.17% | |
| Price / MA100: | -6.54% | |
| Price / MAexp7: | -0.81% | |
| Price / MAexp20: | -1.58% | |
| Price / MAexp50: | -2.52% | |
| Price / MAexp100: | -3.96% |
News
The last news published on AXALTA COATING SYSTEMS at the time of the generation of this analysis was as follows:
- Axalta Irus Mix and Voltatex® 7345 A ECO Wire Enamel Win Silver 2024 Edison Awards™; Low Carbon Footprint Sustainable Coating System with Hyperdur® Primer and Chromadyne® Colorcoat Takes Bronze
- Axalta Named a 2023 General Motors Supplier of the Year
- Axalta Schedules First-Quarter 2024 Earnings Conference Call
- Robert McLaughlin to Retire from Axalta Board of Directors
- Axalta Releases Fourth Quarter and Full Year 2023 Results