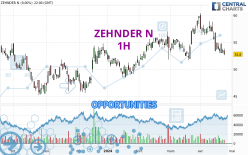
Londinia Opportunities Analyses - 04/25/2024 (GMT) ZEHNDER N - 1H
-
CHF
(-)
-
15 min delayed data - Switzerland SWX Stocks
| Type: | Stocks |
| Ticker: | ZEHN |
| ISIN: | CH0276534614 |
- Europe Stocks
- Timeframe : 1H
- - Analysis generated on
- Status : INVALID
Summary of the analysis
Trends
Short term:
Strongly bearish
Underlying:
Strongly bearish
Technical indicators
11%
78%
11%
My opinion
Bearish under 52.1 CHF
My targets
49.3 CHF (-4.09%)
46.1 CHF (-10.31%)
My analysis
ZEHNDER N is part of a very strong bearish trend. Traders may consider trading only short positions (for sale) as long as the price remains well below 52.1 CHF. The next support located at 49.3 CHF is the next bearish objective to target. A bearish break of this support would revive the bearish momentum. The bearish movement could then continue towards the next support located at 46.1 CHF. Below this support, sellers could then target 40.3 CHF. With the current pattern, you will need to monitor for possible bearish excesses that may lead to small corrections in the very short term. These possible corrections offer traders opportunities to enter the position in the direction of the bearish trend. Trying to profit from the purchase of these possible corrections may seem risky.
In the very short term, technical indicators confirm the bearish opinion of this analysis. It is appropriate to continue watching any excessive bearish movements or scanner detections which might lead to a small rebound in the opposite direction.
Force
0
10
8.2

Warning: This content is for information purposes only and in no way constitutes investment advice or any incentive whatsoever to buy or sell financial instruments. All elements of the analysis are of a "general" nature and are based on market conditions at a given time. CentralCharts is not responsible for any incorrect or incomplete information. Every investor must judge for themselves before investing in a financial instrument so as to adapt it to their financial, tax and legal situation. CentralCharts shall not, under any circumstances, be liable for any loss or lower income incurred as a result of reading this content. Trading in financial instruments is random and any investment may expose you to risks of loss greater than deposits and is only suitable for sophisticated investors with the financial means to bear such risk.
Additional analysis
Quotes
The ZEHNDER N price is 51.4 CHF. The price is lower by -2.65% since the last closing and was between 51.2 CHF and 52.6 CHF. This implies that the price is at +0.39% from its lowest and at -2.28% from its highest.51.2
52.6
51.4
The Central Gaps scanner detects a bearish opening. A small advantage for sellers in the very short term.
Bearish opening
Type : Bearish
Timeframe : Openning
So that you have an overall view of the price change, here is a table showing the variations over several periods:
New LOW record (1 month)
Type : Bearish
Timeframe : Weekly
Technical
Technical analysis of ZEHNDER N in 1H shows a overall strongly bearish trend. The signals given by moving averages are 92.86% bearish. This strong bearish trend is confirmed by the strong signals currently being given by short-term moving averages. The Central Indicators scanner does not detect any result on moving averages that would impact this trend.
Technical indicators are strongly bearish, suggesting that the price decline is expected to continue.
But beware of excesses. The Central Indicators scanner currently detects this:
CCI indicator is oversold : under -100
Type : Neutral
Timeframe : 1 hour
Williams %R indicator is oversold : under -80
Type : Neutral
Timeframe : 1 hour
Pivot points : price is under support 3
Type : Neutral
Timeframe : 1 hour
Price is back under the pivot point
Type : Bearish
Timeframe : Weekly
An analysis of the price chart with the Central Patterns scanner (detector of chart patterns and resistances and supports) shows a result that can have an impact on the price change:
Support of channel is broken
Type : Bearish
Timeframe : 1 hour
No result was found by the Central Candlesticks scanner on Japanese candlesticks.
ProTrendLines
S3
S2
S1
R1
R2
R3
Price
| S3 | S2 | S1 | Price | R1 | R2 | R3 | |
|---|---|---|---|---|---|---|---|
| ProTrendLines | 40.3 | 46.1 | 49.3 | 51.4 | 52.1 | 53.0 | 54.0 |
| Change (%) | -21.60% | -10.31% | -4.09% | - | +1.36% | +3.11% | +5.06% |
| Change | -11.1 | -5.3 | -2.1 | - | +0.7 | +1.6 | +2.6 |
| Level | Intermediate | Minor | Major | - | Intermediate | Intermediate | Major |
To determine price objectives, it is also possible to use the pivot points. Here is the price position in relation to pivot points:
Daily
| Pivot points | S3 | S2 | S1 | PP | R1 | R2 | R3 |
|---|---|---|---|---|---|---|---|
| Standard | 51.1 | 51.9 | 52.3 | 53.1 | 53.5 | 54.3 | 54.7 |
| Camarilla | 52.5 | 52.6 | 52.7 | 52.8 | 52.9 | 53.0 | 53.1 |
| Woodie | 51.0 | 51.8 | 52.2 | 53.0 | 53.4 | 54.2 | 54.6 |
| Fibonacci | 51.9 | 52.3 | 52.6 | 53.1 | 53.5 | 53.8 | 54.3 |
Weekly
| Pivot points | S3 | S2 | S1 | PP | R1 | R2 | R3 |
|---|---|---|---|---|---|---|---|
| Standard | 48.1 | 50.6 | 52.1 | 54.6 | 56.1 | 58.6 | 60.1 |
| Camarilla | 52.6 | 53.0 | 53.3 | 53.7 | 54.1 | 54.4 | 54.8 |
| Woodie | 47.7 | 50.4 | 51.7 | 54.4 | 55.7 | 58.4 | 59.7 |
| Fibonacci | 50.6 | 52.1 | 53.0 | 54.6 | 56.1 | 57.0 | 58.6 |
Monthly
| Pivot points | S3 | S2 | S1 | PP | R1 | R2 | R3 |
|---|---|---|---|---|---|---|---|
| Standard | 46.3 | 49.0 | 54.4 | 57.1 | 62.5 | 65.2 | 70.6 |
| Camarilla | 57.6 | 58.3 | 59.1 | 59.8 | 60.5 | 61.3 | 62.0 |
| Woodie | 47.7 | 49.7 | 55.8 | 57.8 | 63.9 | 65.9 | 72.0 |
| Fibonacci | 49.0 | 52.1 | 54.0 | 57.1 | 60.2 | 62.1 | 65.2 |
Numerical data
The following is the status of the technical indicators and moving averages at the time of publication of this technical analysis:
Technical indicators
Moving averages
| RSI (14): | 32.90 | |
| MACD (12,26,9): | -0.5000 | |
| Directional Movement: | -30.4 | |
| AROON (14): | -92.9 | |
| DEMA (21): | 52.0 | |
| Parabolic SAR (0,02-0,02-0,2): | 53.3 | |
| Elder Ray (13): | -1.0 | |
| Super Trend (3,10): | 52.7 | |
| Zig ZAG (10): | 51.4 | |
| VORTEX (21): | 0.7000 | |
| Stochastique (14,3,5): | 11.00 | |
| TEMA (21): | 51.8 | |
| Williams %R (14): | -92.30 | |
| Chande Momentum Oscillator (20): | -2.1 | |
| Repulse (5,40,3): | -1.4000 | |
| ROCnROLL: | 2 | |
| TRIX (15,9): | -0.1000 | |
| Courbe Coppock: | 5.20 |
| MA7: | 53.2 | |
| MA20: | 55.8 | |
| MA50: | 55.3 | |
| MA100: | 53.1 | |
| MAexp7: | 52.0 | |
| MAexp20: | 52.7 | |
| MAexp50: | 53.5 | |
| MAexp100: | 54.4 | |
| Price / MA7: | -3.38% | |
| Price / MA20: | -7.89% | |
| Price / MA50: | -7.05% | |
| Price / MA100: | -3.20% | |
| Price / MAexp7: | -1.15% | |
| Price / MAexp20: | -2.47% | |
| Price / MAexp50: | -3.93% | |
| Price / MAexp100: | -5.51% |
Quotes :
-
15 min delayed data
-
Actions Suisse SWX
News
The last news published on ZEHNDER N at the time of the generation of this analysis was as follows:
- Lightwave Logic EO Polymer Achieves World-Class Performance of 400Gbps with Plasmonic Mach Zehnder Modulator
- Zehnder Group achieves sales of EUR 762.1 million with an EBIT margin of 7.9%
- Zehnder Group records a decline in sales in an increasingly challenging market environment
- Solid sales and EBIT again in the first half of 2023 in a challenging environment
- Zehnder Group achieved solid sales and EBIT again in the first half of 2023; adjusted outlook for the 2023 financial year