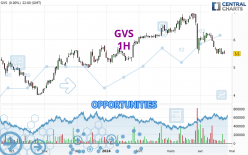
Londinia Opportunities Analyses - 04/25/2024 (GMT) GVS - 1H
-
EUR
(-)
-
15 min delayed data - Italy Stocks
| Type: | Stocks |
| Ticker: | GVS |
| ISIN: | IT0005411209 |
- Europe Stocks
- Timeframe : 1H
- - Analysis generated on
- Status : INVALID
Summary of the analysis
Trends
Short term:
Strongly bearish
Underlying:
Strongly bearish
Technical indicators
6%
89%
6%
My opinion
Bearish under 5.490 EUR
My targets
5.250 EUR (-2.42%)
4.980 EUR (-7.43%)
My analysis
All elements being clearly bearish, it would be possible for traders to trade only short positions (for sale) on GVS as long as the price remains well below 5.490 EUR. The sellers' bearish objective is set at 5.250 EUR. A bearish break of this support would revive the bearish momentum. The sellers could then target the support located at 4.980 EUR. In case of crossing, the next objective would be the support located at 4.020 EUR. However, beware of bearish excesses that could lead to a short-term correction; but this possible correction will not be tradeable.
Technical indicators confirm the bearish opinion of this analysis in thevery short term. However, be careful of excessive bearish movements. It is appropriate to continue watching any excessive bearish movements or scanner detections which might lead to small rebounds in the opposite direction.
Force
0
10
8.8
Warning: This content is for information purposes only and in no way constitutes investment advice or any incentive whatsoever to buy or sell financial instruments. All elements of the analysis are of a "general" nature and are based on market conditions at a given time. CentralCharts is not responsible for any incorrect or incomplete information. Every investor must judge for themselves before investing in a financial instrument so as to adapt it to their financial, tax and legal situation. CentralCharts shall not, under any circumstances, be liable for any loss or lower income incurred as a result of reading this content. Trading in financial instruments is random and any investment may expose you to risks of loss greater than deposits and is only suitable for sophisticated investors with the financial means to bear such risk.
Additional analysis
Quotes
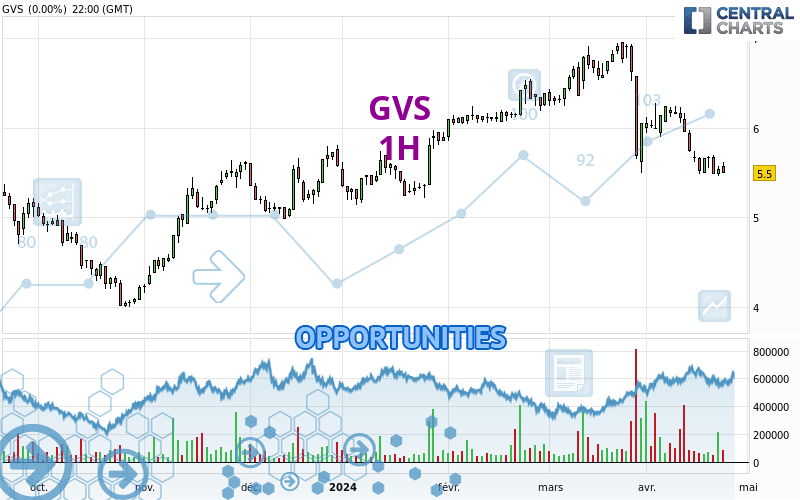
The GVS price is 5.380 EUR. On the day, this instrument lost -2.18% with the lowest point at 5.380 EUR and the highest point at 5.490 EUR. The deviation from the price is 0% for the low point and -2.00% for the high point.5.380
5.490
5.380
The Central Gaps scanner detects the formation of a bearish gap marking the strong presence of sellers ahead of buyers at the opening. This formed a quotation gap.
Opening Gap DOWN
Type : Bearish
Timeframe : Openning
A study of price movements over other periods shows the following variations:
Near a new LOW record (1st january)
Type : Bearish
Timeframe : Weekly
New LOW record (1 month)
Type : Bearish
Timeframe : Weekly
Abnormal volumes on GVS were detected by the Central Volumes scanner:
Abnormal volumes
Timeframe : 20 days
Technical
A technical analysis in 1H of this GVS chart shows a sharp bearish trend. 92.86% of the signals given by moving averages are bearish. This strongly bearish trend is supported by the strong bearish signals given by short-term moving averages. The Central Indicators market scanner currently does not detect any result that concerns moving averages.
In fact, according to the parameters integrated into the Central Analyzer system, 16 technical indicators out of 18 analysed are currently bearish. Caution: the Central Indicators scanner currently detects an excess:
CCI indicator is oversold : under -100
Type : Neutral
Timeframe : 1 hour
Williams %R indicator is oversold : under -80
Type : Neutral
Timeframe : 1 hour
Pivot points : price is under support 1
Type : Neutral
Timeframe : Weekly
Pivot points : price is under support 3
Type : Neutral
Timeframe : 1 hour
An analysis of the price chart with the Central Patterns scanner (detector of chart patterns and resistances and supports) shows a result that can have an impact on the price change:
Support of channel is broken
Type : Bearish
Timeframe : 1 hour
No result was found by the Central Candlesticks scanner on Japanese candlesticks.
ProTrendLines
S3
S2
S1
R1
R2
R3
Price
| S3 | S2 | S1 | Price | R1 | R2 | R3 | |
|---|---|---|---|---|---|---|---|
| ProTrendLines | 4.020 | 4.980 | 5.250 | 5.380 | 5.490 | 5.670 | 5.900 |
| Change (%) | -25.28% | -7.43% | -2.42% | - | +2.04% | +5.39% | +9.67% |
| Change | -1.360 | -0.400 | -0.130 | - | +0.110 | +0.290 | +0.520 |
| Level | Major | Minor | Intermediate | - | Intermediate | Major | Minor |
Attention could also be paid to pivot points to set price objectives:
Daily
| Pivot points | S3 | S2 | S1 | PP | R1 | R2 | R3 |
|---|---|---|---|---|---|---|---|
| Standard | 5.340 | 5.420 | 5.460 | 5.540 | 5.580 | 5.660 | 5.700 |
| Camarilla | 5.467 | 5.478 | 5.489 | 5.500 | 5.511 | 5.522 | 5.533 |
| Woodie | 5.320 | 5.410 | 5.440 | 5.530 | 5.560 | 5.650 | 5.680 |
| Fibonacci | 5.420 | 5.466 | 5.494 | 5.540 | 5.586 | 5.614 | 5.660 |
Weekly
| Pivot points | S3 | S2 | S1 | PP | R1 | R2 | R3 |
|---|---|---|---|---|---|---|---|
| Standard | 4.963 | 5.227 | 5.453 | 5.717 | 5.943 | 6.207 | 6.433 |
| Camarilla | 5.545 | 5.590 | 5.635 | 5.680 | 5.725 | 5.770 | 5.815 |
| Woodie | 4.945 | 5.218 | 5.435 | 5.708 | 5.925 | 6.198 | 6.415 |
| Fibonacci | 5.227 | 5.414 | 5.530 | 5.717 | 5.904 | 6.020 | 6.207 |
Monthly
| Pivot points | S3 | S2 | S1 | PP | R1 | R2 | R3 |
|---|---|---|---|---|---|---|---|
| Standard | 3.920 | 4.710 | 5.380 | 6.170 | 6.840 | 7.630 | 8.300 |
| Camarilla | 5.649 | 5.782 | 5.916 | 6.050 | 6.184 | 6.318 | 6.452 |
| Woodie | 3.860 | 4.680 | 5.320 | 6.140 | 6.780 | 7.600 | 8.240 |
| Fibonacci | 4.710 | 5.268 | 5.612 | 6.170 | 6.728 | 7.072 | 7.630 |
Numerical data
The following is the status of technical indicators and moving averages registered at the time this technical analysis was created:
Technical indicators
Moving averages
| RSI (14): | 33.63 | |
| MACD (12,26,9): | -0.0370 | |
| Directional Movement: | -29.272 | |
| AROON (14): | -50.000 | |
| DEMA (21): | 5.475 | |
| Parabolic SAR (0,02-0,02-0,2): | 5.606 | |
| Elder Ray (13): | -0.079 | |
| Super Trend (3,10): | 5.589 | |
| Zig ZAG (10): | 5.390 | |
| VORTEX (21): | 0.8760 | |
| Stochastique (14,3,5): | 24.64 | |
| TEMA (21): | 5.463 | |
| Williams %R (14): | -100.00 | |
| Chande Momentum Oscillator (20): | -0.150 | |
| Repulse (5,40,3): | -1.2940 | |
| ROCnROLL: | 2 | |
| TRIX (15,9): | -0.0570 | |
| Courbe Coppock: | 1.54 |
| MA7: | 5.540 | |
| MA20: | 5.840 | |
| MA50: | 6.219 | |
| MA100: | 5.875 | |
| MAexp7: | 5.472 | |
| MAexp20: | 5.518 | |
| MAexp50: | 5.588 | |
| MAexp100: | 5.727 | |
| Price / MA7: | -2.89% | |
| Price / MA20: | -7.88% | |
| Price / MA50: | -13.49% | |
| Price / MA100: | -8.43% | |
| Price / MAexp7: | -1.68% | |
| Price / MAexp20: | -2.50% | |
| Price / MAexp50: | -3.72% | |
| Price / MAexp100: | -6.06% |
Quotes :
-
15 min delayed data
-
Actions Italie
News
The latest news and videos published on GVS at the time of the analysis were as follows:
- GVS Revolutionizes Digital Asset Security with Blockchain-Powered Protection Platform
- Applied DNA, EvviVax, and GVS Receive Regulatory Approval to Conduct Veterinary Clinical Trial for Linear COVID-19 Vaccine Candidate