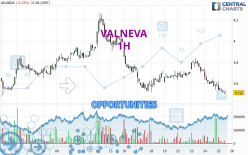
Londinia Opportunities Analyses - 04/25/2024 (GMT) VALNEVA - 1H
-
EUR
(-)
-
15 min delayed data - Euronext Paris
| Type: | Stocks |
| Ticker: | VLA |
| ISIN: | FR0004056851 |
I am delighted to see that my first price objective has been achieved. I hope you've taken advantage of it.
- Europe Stocks
- Timeframe : 1H
- - Analysis generated on
- Status : TARGET REACHED
Summary of the analysis
Trends
Short term:
Strongly bearish
Underlying:
Strongly bearish
Technical indicators
11%
72%
17%
My opinion
Bearish under 3.544 EUR
My targets
3.430 EUR (-2.11%)
3.209 EUR (-8.43%)
My analysis
The bearish trend is currently very strong for VALNEVA. As long as the price remains below the resistance at 3.544 EUR, you could try to take advantage of the bearish rally. The first bearish objective is located at 3.430 EUR. The bearish momentum would be revived by a break in this support. Sellers would then use the next support located at 3.209 EUR as an objective. Crossing it would then enable sellers to target 3.001 EUR. Be careful, given the powerful bearish rally underway, excesses could lead to a short-term rebound. If this is the case, remember that trading against the trend may be riskier. It would seem more appropriate to wait for a signal indicating reversal of the trend.
In the very short term, the general bearish sentiment is confirmed by technical indicators. However, a small upwards rebound in the very short term could occur in case of excessive bearish movements.
Force
0
10
8

Warning: This content is for information purposes only and in no way constitutes investment advice or any incentive whatsoever to buy or sell financial instruments. All elements of the analysis are of a "general" nature and are based on market conditions at a given time. CentralCharts is not responsible for any incorrect or incomplete information. Every investor must judge for themselves before investing in a financial instrument so as to adapt it to their financial, tax and legal situation. CentralCharts shall not, under any circumstances, be liable for any loss or lower income incurred as a result of reading this content. Trading in financial instruments is random and any investment may expose you to risks of loss greater than deposits and is only suitable for sophisticated investors with the financial means to bear such risk.
Additional analysis
Quotes
VALNEVA rating 3.504 EUR. The price registered a decrease of -2.34% on the session and was traded between 3.504 EUR and 3.620 EUR over the period. The price is currently at 0% from its lowest and -3.20% from its highest.3.504
3.620
3.504
A bearish opening was detected by the Central Gaps scanner. Sellers are trying to impose a bearish trend in the very short term.
Bearish opening
Type : Bearish
Timeframe : Openning
Here is a more detailed summary of the historical variations registered by VALNEVA:
Near a new LOW record (1 month)
Type : Bearish
Timeframe : Weekly
Technical
A technical analysis in 1H of this VALNEVA chart shows a sharp bearish trend. The signals given by moving averages are 92.86% bearish. This strong bearish trend is confirmed by the strong signals currently being given by short-term moving averages. The Central Indicators scanner does not detect any result on moving averages that would impact this trend.
Technical indicators are strongly bearish, suggesting that the price decline is expected to continue.
But beware of excesses. The Central Indicators scanner currently detects this:
CCI indicator is oversold : under -100
Type : Neutral
Timeframe : 1 hour
Williams %R indicator is oversold : under -80
Type : Neutral
Timeframe : 1 hour
The Central Patterns scanner, which studies chart patterns, resistances and supports, has identified these signals:
Near horizontal support
Type : Bullish
Timeframe : 1 hour
Support of channel is broken
Type : Bearish
Timeframe : 1 hour
No result was found by the Central Candlesticks scanner on Japanese candlesticks.
ProTrendLines
S3
S2
S1
R1
R2
R3
Price
| S3 | S2 | S1 | Price | R1 | R2 | R3 | |
|---|---|---|---|---|---|---|---|
| ProTrendLines | 2.132 | 3.001 | 3.430 | 3.504 | 3.544 | 3.726 | 3.839 |
| Change (%) | -39.16% | -14.36% | -2.11% | - | +1.14% | +6.34% | +9.56% |
| Change | -1.372 | -0.503 | -0.074 | - | +0.040 | +0.222 | +0.335 |
| Level | Major | Intermediate | Minor | - | Intermediate | Intermediate | Intermediate |
Pivot points can also be used to set your price objectives. Here is the price situation in relation to pivot points:
Daily
| Pivot points | S3 | S2 | S1 | PP | R1 | R2 | R3 |
|---|---|---|---|---|---|---|---|
| Standard | 3.306 | 3.424 | 3.506 | 3.624 | 3.706 | 3.824 | 3.906 |
| Camarilla | 3.533 | 3.551 | 3.570 | 3.588 | 3.606 | 3.625 | 3.643 |
| Woodie | 3.288 | 3.415 | 3.488 | 3.615 | 3.688 | 3.815 | 3.888 |
| Fibonacci | 3.424 | 3.500 | 3.548 | 3.624 | 3.700 | 3.748 | 3.824 |
Weekly
| Pivot points | S3 | S2 | S1 | PP | R1 | R2 | R3 |
|---|---|---|---|---|---|---|---|
| Standard | 2.901 | 3.209 | 3.435 | 3.743 | 3.969 | 4.277 | 4.503 |
| Camarilla | 3.515 | 3.564 | 3.613 | 3.662 | 3.711 | 3.760 | 3.809 |
| Woodie | 2.861 | 3.189 | 3.395 | 3.723 | 3.929 | 4.257 | 4.463 |
| Fibonacci | 3.209 | 3.413 | 3.539 | 3.743 | 3.947 | 4.073 | 4.277 |
Monthly
| Pivot points | S3 | S2 | S1 | PP | R1 | R2 | R3 |
|---|---|---|---|---|---|---|---|
| Standard | 2.075 | 2.512 | 3.075 | 3.512 | 4.075 | 4.512 | 5.075 |
| Camarilla | 3.362 | 3.454 | 3.545 | 3.637 | 3.729 | 3.820 | 3.912 |
| Woodie | 2.137 | 2.544 | 3.137 | 3.544 | 4.137 | 4.544 | 5.137 |
| Fibonacci | 2.512 | 2.894 | 3.130 | 3.512 | 3.894 | 4.130 | 4.512 |
Numerical data
The following is the status of the technical indicators and moving averages at the time of publication of this technical analysis:
Technical indicators
Moving averages
| RSI (14): | 30.52 | |
| MACD (12,26,9): | -0.0440 | |
| Directional Movement: | -19.655 | |
| AROON (14): | -100.000 | |
| DEMA (21): | 3.566 | |
| Parabolic SAR (0,02-0,02-0,2): | 3.614 | |
| Elder Ray (13): | -0.060 | |
| Super Trend (3,10): | 3.651 | |
| Zig ZAG (10): | 3.524 | |
| VORTEX (21): | 0.7510 | |
| Stochastique (14,3,5): | 4.76 | |
| TEMA (21): | 3.533 | |
| Williams %R (14): | -99.09 | |
| Chande Momentum Oscillator (20): | -0.136 | |
| Repulse (5,40,3): | -1.2420 | |
| ROCnROLL: | 2 | |
| TRIX (15,9): | -0.1130 | |
| Courbe Coppock: | 9.48 |
| MA7: | 3.643 | |
| MA20: | 3.739 | |
| MA50: | 3.525 | |
| MA100: | 3.967 | |
| MAexp7: | 3.558 | |
| MAexp20: | 3.616 | |
| MAexp50: | 3.668 | |
| MAexp100: | 3.702 | |
| Price / MA7: | -3.82% | |
| Price / MA20: | -6.29% | |
| Price / MA50: | -0.60% | |
| Price / MA100: | -11.67% | |
| Price / MAexp7: | -1.52% | |
| Price / MAexp20: | -3.10% | |
| Price / MAexp50: | -4.47% | |
| Price / MAexp100: | -5.35% |
Quotes :
-
15 min delayed data
-
Euronext Paris
News
The last news published on VALNEVA at the time of the generation of this analysis was as follows:
- Declaration of voting rights - Valneva SE, March 2024
- Valneva Initiates Phase 1 Trial of Second-Generation Zika Vaccine Candidate
- Valneva Announces Filing of 2023 Universal Registration Document and US Form 20-F
- Valneva Reports Full Year 2023 Results and Provides Business Updates and Outlook
- Valneva Announces Extension of the Interest-Only Period of Its Debt Facility with Deerfield and OrbiMed