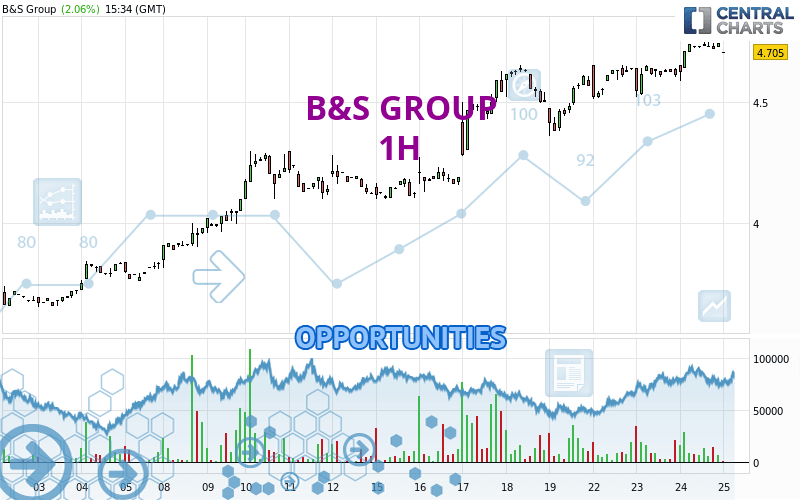
Londinia Opportunities Analyses - 04/25/2024 (GMT) B&S GROUP - 1H
-
EUR
(-)
-
15 min delayed data - Euronext Amsterdam
| Type: | Stocks |
| Ticker: | BSGR |
| ISIN: | LU1789205884 |
I am delighted to see that my first price objective has been achieved. I hope you've taken advantage of it.
- Europe Stocks
- Timeframe : 1H
- - Analysis generated on
- Status : TARGET REACHED
Summary of the analysis
Trends
Short term:
Strongly bullish
Underlying:
Strongly bullish
Technical indicators
72%
0%
28%
My opinion
Bullish above 4.650 EUR
My targets
4.988 EUR (+5.24%)
5.327 EUR (+12.38%)
My analysis
All elements being clearly bullish, it would be possible for traders to trade only long positions (at the time of purchase) on B&S GROUP as long as the price remains well above 4.650 EUR. The buyers' bullish objective is set at 4.988 EUR. A bullish break in this resistance would boost the bullish momentum. The buyers could then target the resistance located at 5.327 EUR. If there is any crossing, the next objective would be the resistance located at 5.442 EUR. However, beware of bullish excesses that could lead to a possible short-term correction; but this possible correction would not be tradeable.
Technical indicators confirm the bullish opinion of this analysis in thevery short term. However, be careful of excessive bullish movements. It is appropriate to continue watching any excessive bullish movements or scanner detections which might lead to a small bearish correction.
Force
0
10
8.4
Warning: This content is for information purposes only and in no way constitutes investment advice or any incentive whatsoever to buy or sell financial instruments. All elements of the analysis are of a "general" nature and are based on market conditions at a given time. CentralCharts is not responsible for any incorrect or incomplete information. Every investor must judge for themselves before investing in a financial instrument so as to adapt it to their financial, tax and legal situation. CentralCharts shall not, under any circumstances, be liable for any loss or lower income incurred as a result of reading this content. Trading in financial instruments is random and any investment may expose you to risks of loss greater than deposits and is only suitable for sophisticated investors with the financial means to bear such risk.
Additional analysis
Quotes
The B&S GROUP rating is 4.740 EUR. The price registered an increase of +2.82% on the session with the lowest point at 4.585 EUR and the highest point at 4.745 EUR. The deviation from the price is +3.38% for the low point and -0.11% for the high point.4.585
4.745
4.740
A bullish opening was detected by the Central Gaps scanner. Buyers are trying to impose a bullish momentum in the very short term.
Bullish opening
Type : Bullish
Timeframe : Openning
A study of price movements over other periods shows the following variations:
New HIGH record (1 year)
Type : Bullish
Timeframe : Weekly
New HIGH record (1st january)
Type : Bullish
Timeframe : Weekly
New HIGH record (1 month)
Type : Bullish
Timeframe : Weekly
Technical
A technical analysis in 1H of this B&S GROUP chart shows a strongly bullish trend. 92.86% of the signals given by moving averages are bullish. This strongly bullish trend is supported by the strong bullish signals given by short-term moving averages. The Central Indicators market scanner currently does not detect any result that concerns moving averages.
An assessment of technical indicators shows a strong bullish signal.
But beware of excesses. The Central Indicators scanner currently detects this:
Williams %R indicator is overbought : over -20
Type : Neutral
Timeframe : 1 hour
Pivot points : price is over resistance 2
Type : Neutral
Timeframe : 1 hour
Central Patterns, the market scanner focusing on chart patterns, resistances and supports found this result:
Near resistance of channel
Type : Bearish
Timeframe : 1 hour
No result was found by the Central Candlesticks scanner on Japanese candlesticks.
ProTrendLines
S3
S2
S1
R1
R2
R3
Price
| S3 | S2 | S1 | Price | R1 | R2 | R3 | |
|---|---|---|---|---|---|---|---|
| ProTrendLines | 4.100 | 4.225 | 4.650 | 4.740 | 5.442 | 6.415 | 7.415 |
| Change (%) | -13.50% | -10.86% | -1.90% | - | +14.81% | +35.34% | +56.43% |
| Change | -0.640 | -0.515 | -0.090 | - | +0.702 | +1.675 | +2.675 |
| Level | Minor | Intermediate | Major | - | Minor | Minor | Minor |
Attention could also be paid to pivot points to set price objectives:
Daily
| Pivot points | S3 | S2 | S1 | PP | R1 | R2 | R3 |
|---|---|---|---|---|---|---|---|
| Standard | 4.407 | 4.463 | 4.537 | 4.593 | 4.667 | 4.723 | 4.797 |
| Camarilla | 4.574 | 4.586 | 4.598 | 4.610 | 4.622 | 4.634 | 4.646 |
| Woodie | 4.415 | 4.468 | 4.545 | 4.598 | 4.675 | 4.728 | 4.805 |
| Fibonacci | 4.463 | 4.513 | 4.544 | 4.593 | 4.643 | 4.674 | 4.723 |
Weekly
| Pivot points | S3 | S2 | S1 | PP | R1 | R2 | R3 |
|---|---|---|---|---|---|---|---|
| Standard | 3.677 | 3.888 | 4.227 | 4.438 | 4.777 | 4.988 | 5.327 |
| Camarilla | 4.414 | 4.464 | 4.515 | 4.565 | 4.615 | 4.666 | 4.716 |
| Woodie | 3.740 | 3.920 | 4.290 | 4.470 | 4.840 | 5.020 | 5.390 |
| Fibonacci | 3.888 | 4.098 | 4.228 | 4.438 | 4.648 | 4.778 | 4.988 |
Monthly
| Pivot points | S3 | S2 | S1 | PP | R1 | R2 | R3 |
|---|---|---|---|---|---|---|---|
| Standard | 3.267 | 3.358 | 3.517 | 3.608 | 3.767 | 3.858 | 4.017 |
| Camarilla | 3.606 | 3.629 | 3.652 | 3.675 | 3.698 | 3.721 | 3.744 |
| Woodie | 3.300 | 3.375 | 3.550 | 3.625 | 3.800 | 3.875 | 4.050 |
| Fibonacci | 3.358 | 3.454 | 3.513 | 3.608 | 3.704 | 3.763 | 3.858 |
Numerical data
The following is the status of technical indicators and moving averages registered at the time this technical analysis was created:
Technical indicators
Moving averages
| RSI (14): | 65.29 | |
| MACD (12,26,9): | 0.0490 | |
| Directional Movement: | 3.586 | |
| AROON (14): | 35.714 | |
| DEMA (21): | 4.734 | |
| Parabolic SAR (0,02-0,02-0,2): | 4.623 | |
| Elder Ray (13): | 0.039 | |
| Super Trend (3,10): | 4.627 | |
| Zig ZAG (10): | 4.740 | |
| VORTEX (21): | 1.0650 | |
| Stochastique (14,3,5): | 89.58 | |
| TEMA (21): | 4.737 | |
| Williams %R (14): | -3.13 | |
| Chande Momentum Oscillator (20): | 0.130 | |
| Repulse (5,40,3): | 0.1410 | |
| ROCnROLL: | 1 | |
| TRIX (15,9): | 0.1400 | |
| Courbe Coppock: | 4.54 |
| MA7: | 4.541 | |
| MA20: | 4.129 | |
| MA50: | 3.835 | |
| MA100: | 3.785 | |
| MAexp7: | 4.718 | |
| MAexp20: | 4.669 | |
| MAexp50: | 4.566 | |
| MAexp100: | 4.401 | |
| Price / MA7: | +4.38% | |
| Price / MA20: | +14.80% | |
| Price / MA50: | +23.60% | |
| Price / MA100: | +25.23% | |
| Price / MAexp7: | +0.47% | |
| Price / MAexp20: | +1.52% | |
| Price / MAexp50: | +3.81% | |
| Price / MAexp100: | +7.70% |
Quotes :
-
15 min delayed data
-
Euronext Amsterdam
News
Don't forget to follow the news on B&S GROUP. At the time of publication of this analysis, the latest news was as follows:
-
 Steve Hilton: Biden mask policy is 'pure BS plucked out of thin air'
-
George Galloway l The Russian Bounty BS
-
Graham blasts the Dems, 'Impeachment is manufactured BS'
-
The real story (no BS) behind the US attack on Iran (full show)
- B.S.D. Crown Ltd. - TR-1: Standard form for notification of major holdings