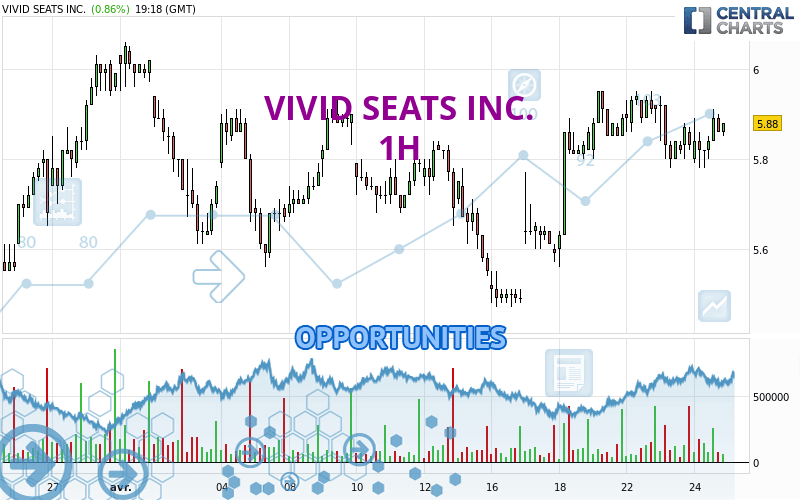
Londinia Opportunities Analyses - 04/24/2024 (GMT) VIVID SEATS INC. - 1H
- U.S. Stocks
- Timeframe : 1H
- - Analysis generated on
- Status : INVALID
Summary of the analysis
Trends
Short term:
Bullish
Underlying:
Strongly bullish
Technical indicators
50%
28%
22%
My opinion
Bullish above 5.84 USD
My targets
5.95 USD (+1.36%)
6.06 USD (+3.24%)
My analysis
The basic bullish trend is very strong on VIVID SEATS INC. but the short term shows some signs of running out of steam. However, a purchase could be considered as long as the price remains above 5.84 USD. Crossing the first resistance at 5.95 USD would be a sign of a potential new surge in the price. Buyers would then use the next resistance located at 6.06 USD as an objective. Crossing it would then enable buyers to target 6.28 USD. Caution, a return to below 5.84 USD would be a sign of a consolidation phase in the short-term basic trend. If this is the case, remember that trading against the trend may be riskier. It would seem more appropriate to wait for a signal indicating reversal of the trend.
In the very short term, the general bullish sentiment is not called into question, despite technical indicators being indecisive.
Force
0
10
5

Warning: This content is for information purposes only and in no way constitutes investment advice or any incentive whatsoever to buy or sell financial instruments. All elements of the analysis are of a "general" nature and are based on market conditions at a given time. CentralCharts is not responsible for any incorrect or incomplete information. Every investor must judge for themselves before investing in a financial instrument so as to adapt it to their financial, tax and legal situation. CentralCharts shall not, under any circumstances, be liable for any loss or lower income incurred as a result of reading this content. Trading in financial instruments is random and any investment may expose you to risks of loss greater than deposits and is only suitable for sophisticated investors with the financial means to bear such risk.
Additional analysis
Quotes
The VIVID SEATS INC. price is 5.87 USD. On the day, this instrument gained +0.69% and was traded between 5.78 USD and 5.91 USD over the period. The price is currently at +1.56% from its lowest and -0.68% from its highest.5.78
5.91
5.87
The Central Gaps scanner detects a bearish opening. A small advantage for sellers in the very short term.
Bearish opening
Type : Bearish
Timeframe : Openning
Here is a more detailed summary of the historical variations registered by VIVID SEATS INC.:
Near a new HIGH record (1 month)
Type : Bullish
Timeframe : Weekly
Technical
Technical analysis of VIVID SEATS INC. in 1H shows a strongly overall bullish trend. The signals given by moving averages are 82.14% bullish. This strongly bullish trend seems to be running out of steam given the signals being given by short-term moving averages. There is no crossing of moving average by the price or crossing of moving averages between themselves.
In fact, Central Analyzer took into account 18 technical indicators and the result was as follows: 9 are bullish, 4 are neutral and 5 are bearish. The Central Indicators scanner found this result concerning these indicators:
Price is back over the pivot point
Type : Bullish
Timeframe : 1 hour
Central Patterns, the scanner specializing in chart patterns, did not identify any signals.
The Central Candlesticks scanner which studies Japanese candlesticks did not detect anything.
ProTrendLines
S3
S2
S1
R1
R2
R3
Price
| S3 | S2 | S1 | Price | R1 | R2 | R3 | |
|---|---|---|---|---|---|---|---|
| ProTrendLines | 5.68 | 5.77 | 5.84 | 5.87 | 5.95 | 6.06 | 6.28 |
| Change (%) | -3.24% | -1.70% | -0.51% | - | +1.36% | +3.24% | +6.98% |
| Change | -0.19 | -0.10 | -0.03 | - | +0.08 | +0.19 | +0.41 |
| Level | Major | Minor | Minor | - | Intermediate | Minor | Intermediate |
To determine price objectives, it is also possible to use the pivot points. Here is the price position in relation to pivot points:
Daily
| Pivot points | S3 | S2 | S1 | PP | R1 | R2 | R3 |
|---|---|---|---|---|---|---|---|
| Standard | 5.60 | 5.69 | 5.76 | 5.85 | 5.92 | 6.01 | 6.08 |
| Camarilla | 5.79 | 5.80 | 5.82 | 5.83 | 5.85 | 5.86 | 5.87 |
| Woodie | 5.59 | 5.69 | 5.75 | 5.85 | 5.91 | 6.01 | 6.07 |
| Fibonacci | 5.69 | 5.75 | 5.79 | 5.85 | 5.91 | 5.95 | 6.01 |
Weekly
| Pivot points | S3 | S2 | S1 | PP | R1 | R2 | R3 |
|---|---|---|---|---|---|---|---|
| Standard | 5.11 | 5.29 | 5.59 | 5.77 | 6.07 | 6.25 | 6.55 |
| Camarilla | 5.76 | 5.80 | 5.85 | 5.89 | 5.93 | 5.98 | 6.02 |
| Woodie | 5.17 | 5.32 | 5.65 | 5.80 | 6.13 | 6.28 | 6.61 |
| Fibonacci | 5.29 | 5.47 | 5.59 | 5.77 | 5.95 | 6.07 | 6.25 |
Monthly
| Pivot points | S3 | S2 | S1 | PP | R1 | R2 | R3 |
|---|---|---|---|---|---|---|---|
| Standard | 4.06 | 4.58 | 5.29 | 5.81 | 6.52 | 7.04 | 7.75 |
| Camarilla | 5.65 | 5.77 | 5.88 | 5.99 | 6.10 | 6.22 | 6.33 |
| Woodie | 4.15 | 4.63 | 5.38 | 5.86 | 6.61 | 7.09 | 7.84 |
| Fibonacci | 4.58 | 5.05 | 5.34 | 5.81 | 6.28 | 6.57 | 7.04 |
Numerical data
The following is the status of the technical indicators and moving averages at the time of publication of this technical analysis:
Technical indicators
Moving averages
| RSI (14): | 55.85 | |
| MACD (12,26,9): | 0.0200 | |
| Directional Movement: | 6.23 | |
| AROON (14): | -71.43 | |
| DEMA (21): | 5.88 | |
| Parabolic SAR (0,02-0,02-0,2): | 5.91 | |
| Elder Ray (13): | 0.03 | |
| Super Trend (3,10): | 5.76 | |
| Zig ZAG (10): | 5.89 | |
| VORTEX (21): | 0.9900 | |
| Stochastique (14,3,5): | 55.21 | |
| TEMA (21): | 5.87 | |
| Williams %R (14): | -31.25 | |
| Chande Momentum Oscillator (20): | -0.10 | |
| Repulse (5,40,3): | -0.0400 | |
| ROCnROLL: | -1 | |
| TRIX (15,9): | 0.0500 | |
| Courbe Coppock: | 1.38 |
| MA7: | 5.78 | |
| MA20: | 5.78 | |
| MA50: | 5.80 | |
| MA100: | 6.08 | |
| MAexp7: | 5.85 | |
| MAexp20: | 5.85 | |
| MAexp50: | 5.81 | |
| MAexp100: | 5.77 | |
| Price / MA7: | +1.56% | |
| Price / MA20: | +1.56% | |
| Price / MA50: | +1.21% | |
| Price / MA100: | -3.45% | |
| Price / MAexp7: | +0.34% | |
| Price / MAexp20: | +0.34% | |
| Price / MAexp50: | +1.03% | |
| Price / MAexp100: | +1.73% |
Quotes :
-
15 min delayed data
-
Actions NASDAQ
News
The last news published on VIVID SEATS INC. at the time of the generation of this analysis was as follows:
- Vivid Seats Honored as one of Fast Company’s World’s Most Innovative Companies of 2024
- Vivid Seats to Participate in Canaccord Genuity's eCommerce Sustainable Advantage Forum
- Vivid Seats Reports Fourth Quarter Results and Authorizes New Share Repurchase Program
- Vivid Seats to Participate in Morgan Stanley’s 2024 Technology, Media & Telecom Conference
- Vivid Seats to Report Fourth Quarter and Full Year 2023 Financial Results