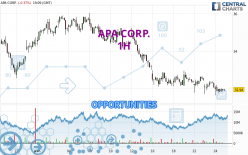
Londinia Opportunities Analyses - 04/24/2024 (GMT) APA CORP. - 1H
- U.S. Stocks
- Timeframe : 1H
- - Analysis generated on
- Status : INVALID
Summary of the analysis
Trends
Short term:
Strongly bearish
Underlying:
Strongly bearish
Technical indicators
11%
78%
11%
My opinion
Bearish under 32.06 USD
My targets
31.50 USD (-1.19%)
29.41 USD (-7.75%)
My analysis
All elements being clearly bearish, it would be possible for traders to trade only short positions (for sale) on APA CORP. as long as the price remains well below 32.06 USD. The sellers' bearish objective is set at 31.50 USD. A bearish break of this support would revive the bearish momentum. The sellers could then target the support located at 29.41 USD. In case of crossing, the next objective would be the support located at 21.99 USD. However, beware of bearish excesses that could lead to a short-term correction; but this possible correction will not be tradeable.
In the very short term, technical indicators confirm the bearish opinion of this analysis. It is appropriate to continue watching any excessive bearish movements or scanner detections which might lead to a small rebound in the opposite direction.
Force
0
10
8.2

Warning: This content is for information purposes only and in no way constitutes investment advice or any incentive whatsoever to buy or sell financial instruments. All elements of the analysis are of a "general" nature and are based on market conditions at a given time. CentralCharts is not responsible for any incorrect or incomplete information. Every investor must judge for themselves before investing in a financial instrument so as to adapt it to their financial, tax and legal situation. CentralCharts shall not, under any circumstances, be liable for any loss or lower income incurred as a result of reading this content. Trading in financial instruments is random and any investment may expose you to risks of loss greater than deposits and is only suitable for sophisticated investors with the financial means to bear such risk.
Additional analysis
Quotes
The APA CORP. price is 31.88 USD. The price registered a decrease of -0.56% on the session and was traded between 31.64 USD and 32.19 USD over the period. The price is currently at +0.76% from its lowest and -0.96% from its highest.31.64
32.19
31.88
The Central Gaps scanner detects a bearish opening marking the presence of sellers ahead of buyers at the opening but not sufficiently marked to allow the price to register a quotation gap.
Bearish opening
Type : Bearish
Timeframe : Openning
A study of price movements over other periods shows the following variations:
New LOW record (1 month)
Type : Bearish
Timeframe : Weekly
Technical
Technical analysis of APA CORP. in 1H shows a overall strongly bearish trend. 92.86% of the signals given by moving averages are bearish. This strongly bearish trend is supported by the strong bearish signals given by short-term moving averages. The Central Indicators scanner does not detect any result on moving averages that would impact this trend.
In fact, 14 technical indicators on 18 studied are currently bearish. The Central Indicators scanner found no further results concerning independent technical indicators.
The analysis of the price chart with Central Patterns scanners does not return any result.
The Central Candlesticks scanner, specialised in Japanese candlesticks, did not identify any signals.
ProTrendLines
S3
S2
S1
R1
R2
R3
Price
| S3 | S2 | S1 | Price | R1 | R2 | R3 | |
|---|---|---|---|---|---|---|---|
| ProTrendLines | 21.99 | 29.41 | 31.50 | 31.88 | 32.06 | 32.65 | 33.86 |
| Change (%) | -31.02% | -7.75% | -1.19% | - | +0.56% | +2.42% | +6.21% |
| Change | -9.89 | -2.47 | -0.38 | - | +0.18 | +0.77 | +1.98 |
| Level | Minor | Intermediate | Major | - | Minor | Intermediate | Minor |
To determine price objectives, it is also possible to use the pivot points. Here is the price position in relation to pivot points:
Daily
| Pivot points | S3 | S2 | S1 | PP | R1 | R2 | R3 |
|---|---|---|---|---|---|---|---|
| Standard | 31.05 | 31.38 | 31.72 | 32.05 | 32.39 | 32.72 | 33.06 |
| Camarilla | 31.88 | 31.94 | 32.00 | 32.06 | 32.12 | 32.18 | 32.24 |
| Woodie | 31.06 | 31.38 | 31.73 | 32.05 | 32.40 | 32.72 | 33.07 |
| Fibonacci | 31.38 | 31.64 | 31.79 | 32.05 | 32.31 | 32.46 | 32.72 |
Weekly
| Pivot points | S3 | S2 | S1 | PP | R1 | R2 | R3 |
|---|---|---|---|---|---|---|---|
| Standard | 29.85 | 30.85 | 31.61 | 32.61 | 33.37 | 34.37 | 35.13 |
| Camarilla | 31.88 | 32.04 | 32.20 | 32.36 | 32.52 | 32.68 | 32.84 |
| Woodie | 29.72 | 30.79 | 31.48 | 32.55 | 33.24 | 34.31 | 35.00 |
| Fibonacci | 30.85 | 31.53 | 31.94 | 32.61 | 33.29 | 33.70 | 34.37 |
Monthly
| Pivot points | S3 | S2 | S1 | PP | R1 | R2 | R3 |
|---|---|---|---|---|---|---|---|
| Standard | 26.17 | 27.92 | 31.02 | 32.77 | 35.87 | 37.62 | 40.72 |
| Camarilla | 32.78 | 33.22 | 33.67 | 34.11 | 34.56 | 35.00 | 35.44 |
| Woodie | 26.84 | 28.26 | 31.69 | 33.11 | 36.54 | 37.96 | 41.39 |
| Fibonacci | 27.92 | 29.78 | 30.92 | 32.77 | 34.63 | 35.77 | 37.62 |
Numerical data
The following are the details of the technical indicators and moving averages that were collected to generate this technical analysis:
Technical indicators
Moving averages
| RSI (14): | 40.33 | |
| MACD (12,26,9): | -0.1400 | |
| Directional Movement: | -18.04 | |
| AROON (14): | -64.29 | |
| DEMA (21): | 31.95 | |
| Parabolic SAR (0,02-0,02-0,2): | 32.29 | |
| Elder Ray (13): | -0.16 | |
| Super Trend (3,10): | 32.66 | |
| Zig ZAG (10): | 31.90 | |
| VORTEX (21): | 0.9300 | |
| Stochastique (14,3,5): | 26.58 | |
| TEMA (21): | 31.96 | |
| Williams %R (14): | -71.20 | |
| Chande Momentum Oscillator (20): | -0.16 | |
| Repulse (5,40,3): | -0.0800 | |
| ROCnROLL: | 2 | |
| TRIX (15,9): | -0.0500 | |
| Courbe Coppock: | 2.42 |
| MA7: | 32.18 | |
| MA20: | 33.66 | |
| MA50: | 32.14 | |
| MA100: | 32.55 | |
| MAexp7: | 31.95 | |
| MAexp20: | 32.13 | |
| MAexp50: | 32.48 | |
| MAexp100: | 32.90 | |
| Price / MA7: | -0.93% | |
| Price / MA20: | -5.29% | |
| Price / MA50: | -0.81% | |
| Price / MA100: | -2.06% | |
| Price / MAexp7: | -0.22% | |
| Price / MAexp20: | -0.78% | |
| Price / MAexp50: | -1.85% | |
| Price / MAexp100: | -3.10% |
Quotes :
-
15 min delayed data
-
Actions NASDAQ
News
Don't forget to follow the news on APA CORP.. At the time of publication of this analysis, the latest news was as follows:
- AWS Announces General Availability of Amazon Keyspaces (for Apache Cassandra)
- Instaclustr Achieves PCI-DSS Certification for its Managed Apache Cassandra and Kafka Offerings on AWS
- ScyllaDB Extends Support for Streaming with High-Performance Apache Kafka™ Connector
- AWS Announces Amazon Managed (Apache) Cassandra Service
- Rockset Unveils Real-Time SQL Analytics for Raw Events from Apache Kafka®