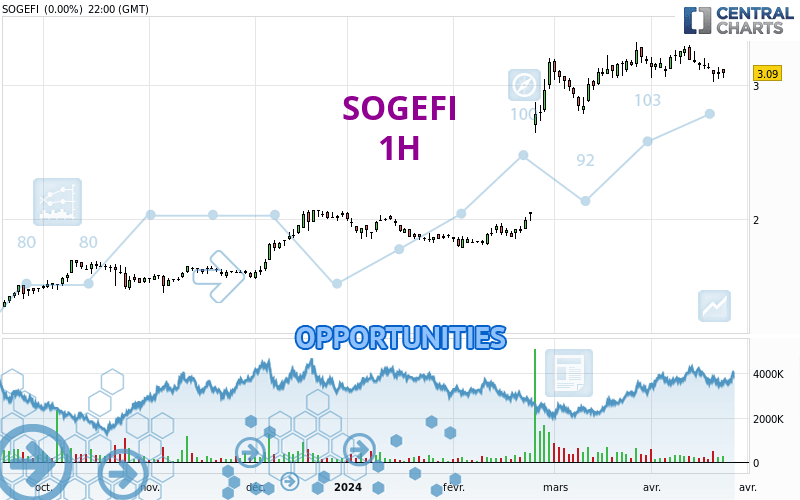
Londinia Opportunities Analyses - 04/24/2024 (GMT) SOGEFI - 1H
-
EUR
(-)
-
15 min delayed data - Italy Stocks
| Type: | Stocks |
| Ticker: | SGF |
| ISIN: | IT0000076536 |
I am delighted to see that my first price objective has been achieved. I hope you've taken advantage of it.
- Europe Stocks
- Timeframe : 1H
- - Analysis generated on
- Status : TARGET REACHED
Summary of the analysis
Trends
Short term:
Strongly bearish
Underlying:
Strongly bearish
Technical indicators
11%
72%
17%
My opinion
Bearish under 3.050 EUR
My targets
2.887 EUR (-3.94%)
2.840 EUR (-5.49%)
My analysis
All elements being clearly bearish, it would be possible for traders to trade only short positions (for sale) on SOGEFI as long as the price remains well below 3.050 EUR. The sellers' bearish objective is set at 2.887 EUR. A bearish break of this support would revive the bearish momentum. The sellers could then target the support located at 2.840 EUR. In case of crossing, the next objective would be the support located at 2.507 EUR. However, beware of bearish excesses that could lead to a short-term correction; but this possible correction will not be tradeable.
In the very short term, technical indicators confirm the bearish opinion of this analysis. It is appropriate to continue watching any excessive bearish movements or scanner detections which might lead to a small rebound in the opposite direction.
Force
0
10
8

Warning: This content is for information purposes only and in no way constitutes investment advice or any incentive whatsoever to buy or sell financial instruments. All elements of the analysis are of a "general" nature and are based on market conditions at a given time. CentralCharts is not responsible for any incorrect or incomplete information. Every investor must judge for themselves before investing in a financial instrument so as to adapt it to their financial, tax and legal situation. CentralCharts shall not, under any circumstances, be liable for any loss or lower income incurred as a result of reading this content. Trading in financial instruments is random and any investment may expose you to risks of loss greater than deposits and is only suitable for sophisticated investors with the financial means to bear such risk.
Additional analysis
Quotes
The SOGEFI rating is 3.005 EUR. The price is lower by -2.75% since the last closing and was traded between 2.990 EUR and 3.130 EUR over the period. The price is currently at +0.50% from its lowest and -3.99% from its highest.2.990
3.130
3.005
A bullish gap was detected at the opening by the Central Gaps scanner. There are a lot of buyers and they have the upper hand in the very short term.
Opening Gap UP
Type : Bullish
Timeframe : Openning
Here is a more detailed summary of the historical variations registered by SOGEFI:
New LOW record (1 month)
Type : Bearish
Timeframe : Weekly
Technical
Technical analysis of this 1H chart of SOGEFI indicates that the overall trend is strongly bearish. 92.86% of the signals given by moving averages are bearish. This strongly bearish trend is supported by the strong bearish signals given by short-term moving averages. The Central Indicators scanner does not detect any result on moving averages that would impact this trend.
In fact, 13 technical indicators on 18 studied are currently bearish. Caution: the Central Indicators scanner currently detects an excess:
CCI indicator is oversold : under -100
Type : Neutral
Timeframe : 1 hour
Williams %R indicator is oversold : under -80
Type : Neutral
Timeframe : 1 hour
Pivot points : price is under support 3
Type : Neutral
Timeframe : 1 hour
An analysis of the price chart with the Central Patterns scanner (detector of chart patterns and resistances and supports) shows several results that can have an impact on the price change:
Near horizontal support
Type : Bullish
Timeframe : 1 hour
Near support of channel
Type : Bullish
Timeframe : 1 hour
No result was found by the Central Candlesticks scanner on Japanese candlesticks.
ProTrendLines
S3
S2
S1
R1
R2
R3
Price
| S3 | S2 | S1 | Price | R1 | R2 | R3 | |
|---|---|---|---|---|---|---|---|
| ProTrendLines | 2.070 | 2.507 | 2.840 | 3.005 | 3.020 | 3.050 | 3.105 |
| Change (%) | -31.11% | -16.57% | -5.49% | - | +0.50% | +1.50% | +3.33% |
| Change | -0.935 | -0.498 | -0.165 | - | +0.015 | +0.045 | +0.100 |
| Level | Major | Minor | Minor | - | Minor | Intermediate | Intermediate |
Attention could also be paid to pivot points to set price objectives:
Daily
| Pivot points | S3 | S2 | S1 | PP | R1 | R2 | R3 |
|---|---|---|---|---|---|---|---|
| Standard | 2.983 | 3.017 | 3.053 | 3.087 | 3.123 | 3.157 | 3.193 |
| Camarilla | 3.071 | 3.077 | 3.084 | 3.090 | 3.096 | 3.103 | 3.109 |
| Woodie | 2.985 | 3.018 | 3.055 | 3.088 | 3.125 | 3.158 | 3.195 |
| Fibonacci | 3.017 | 3.043 | 3.060 | 3.087 | 3.113 | 3.130 | 3.157 |
Weekly
| Pivot points | S3 | S2 | S1 | PP | R1 | R2 | R3 |
|---|---|---|---|---|---|---|---|
| Standard | 2.753 | 2.887 | 2.983 | 3.117 | 3.213 | 3.347 | 3.443 |
| Camarilla | 3.017 | 3.038 | 3.059 | 3.080 | 3.101 | 3.122 | 3.143 |
| Woodie | 2.735 | 2.878 | 2.965 | 3.108 | 3.195 | 3.338 | 3.425 |
| Fibonacci | 2.887 | 2.975 | 3.029 | 3.117 | 3.205 | 3.259 | 3.347 |
Monthly
| Pivot points | S3 | S2 | S1 | PP | R1 | R2 | R3 |
|---|---|---|---|---|---|---|---|
| Standard | 2.337 | 2.558 | 2.877 | 3.098 | 3.417 | 3.638 | 3.957 |
| Camarilla | 3.047 | 3.096 | 3.146 | 3.195 | 3.245 | 3.294 | 3.344 |
| Woodie | 2.385 | 2.583 | 2.925 | 3.123 | 3.465 | 3.663 | 4.005 |
| Fibonacci | 2.558 | 2.765 | 2.892 | 3.098 | 3.305 | 3.432 | 3.638 |
Numerical data
The following is the status of technical indicators and moving averages registered at the time this technical analysis was created:
Technical indicators
Moving averages
| RSI (14): | 35.23 | |
| MACD (12,26,9): | -0.0180 | |
| Directional Movement: | -10.191 | |
| AROON (14): | -21.429 | |
| DEMA (21): | 3.049 | |
| Parabolic SAR (0,02-0,02-0,2): | 3.128 | |
| Elder Ray (13): | -0.052 | |
| Super Trend (3,10): | 3.125 | |
| Zig ZAG (10): | 3.005 | |
| VORTEX (21): | 0.8390 | |
| Stochastique (14,3,5): | 12.27 | |
| TEMA (21): | 3.046 | |
| Williams %R (14): | -89.29 | |
| Chande Momentum Oscillator (20): | -0.055 | |
| Repulse (5,40,3): | -1.7320 | |
| ROCnROLL: | 2 | |
| TRIX (15,9): | -0.0520 | |
| Courbe Coppock: | 2.37 |
| MA7: | 3.096 | |
| MA20: | 3.161 | |
| MA50: | 2.884 | |
| MA100: | 2.389 | |
| MAexp7: | 3.048 | |
| MAexp20: | 3.071 | |
| MAexp50: | 3.102 | |
| MAexp100: | 3.129 | |
| Price / MA7: | -2.94% | |
| Price / MA20: | -4.94% | |
| Price / MA50: | +4.20% | |
| Price / MA100: | +25.78% | |
| Price / MAexp7: | -1.41% | |
| Price / MAexp20: | -2.15% | |
| Price / MAexp50: | -3.13% | |
| Price / MAexp100: | -3.96% |
Quotes :
-
15 min delayed data
-
Actions Italie
News
Don't forget to follow the news on SOGEFI. At the time of publication of this analysis, the latest news was as follows:
- Pacific Avenue Capital Partners Announces Signing of Put Option Agreement to Acquire Purflux, Currently Known as the Filtration Business Unit of Sogefi S.p.A.
-
 Sogefi
-
Sogefi