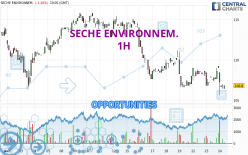
Londinia Opportunities Analyses - 04/24/2024 (GMT) SECHE ENVIRONNEM. - 1H
-
EUR
(-)
-
15 min delayed data - Euronext Paris
| Type: | Stocks |
| Ticker: | SCHP |
| ISIN: | FR0000039109 |
I am delighted to see that my first price objective has been achieved. I hope you've taken advantage of it.
- Europe Stocks
- Timeframe : 1H
- - Analysis generated on
- Status : TARGET REACHED
Summary of the analysis
Trends
Short term:
Strongly bearish
Underlying:
Strongly bearish
Technical indicators
17%
61%
22%
My opinion
Bearish under 107.8 EUR
My targets
103.8 EUR (-2.81%)
101.0 EUR (-5.43%)
My analysis
SECHE ENVIRONNEM. is part of a very strong bearish trend. Traders may consider trading only short positions (for sale) as long as the price remains well below 107.8 EUR. The next support located at 103.8 EUR is the next bearish objective to target. A bearish break of this support would revive the bearish momentum. The bearish movement could then continue towards the next support located at 101.0 EUR. Below this support, sellers could then target 90.5 EUR. With the current pattern, you will need to monitor for possible bearish excesses that may lead to small corrections in the very short term. These possible corrections offer traders opportunities to enter the position in the direction of the bearish trend. Trying to profit from the purchase of these possible corrections may seem risky.
In the very short term, the general bearish sentiment is confirmed by technical indicators. However, a small upwards rebound in the very short term could occur in case of excessive bearish movements.
Force
0
10
7.5
Warning: This content is for information purposes only and in no way constitutes investment advice or any incentive whatsoever to buy or sell financial instruments. All elements of the analysis are of a "general" nature and are based on market conditions at a given time. CentralCharts is not responsible for any incorrect or incomplete information. Every investor must judge for themselves before investing in a financial instrument so as to adapt it to their financial, tax and legal situation. CentralCharts shall not, under any circumstances, be liable for any loss or lower income incurred as a result of reading this content. Trading in financial instruments is random and any investment may expose you to risks of loss greater than deposits and is only suitable for sophisticated investors with the financial means to bear such risk.
Additional analysis
Quotes
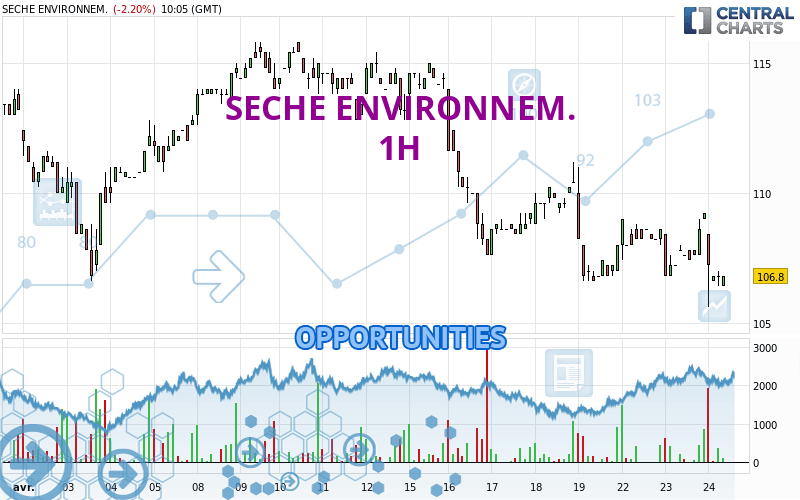
The SECHE ENVIRONNEM. price is 106.8 EUR. On the day, this instrument lost -2.20% with the lowest point at 105.6 EUR and the highest point at 108.4 EUR. The deviation from the price is +1.14% for the low point and -1.48% for the high point.105.6
108.4
106.8
The Central Gaps scanner detects a bearish opening. A small advantage for sellers in the very short term.
Bearish opening
Type : Bearish
Timeframe : Openning
Here is a more detailed summary of the historical variations registered by SECHE ENVIRONNEM.:
New LOW record (1 month)
Type : Bearish
Timeframe : Weekly
Technical
Technical analysis of SECHE ENVIRONNEM. in 1H shows a overall strongly bearish trend. 92.86% of the signals given by moving averages are bearish. The overall trend is supported by the strong bearish signals from short-term moving averages. There is no crossing of moving average by the price or crossing of moving averages between themselves.
In fact, according to the parameters integrated into the Central Analyzer system, 11 technical indicators out of 18 analysed are currently bearish. But beware of excesses. The Central Indicators scanner currently detects this:
CCI indicator is oversold : under -100
Type : Neutral
Timeframe : 1 hour
Pivot points : price is under support 1
Type : Neutral
Timeframe : 1 hour
MACD crosses DOWN its Moving Average
Type : Bearish
Timeframe : 1 hour
The analysis of the price chart with Central Patterns scanners does not return any result.
No result was found by the Central Candlesticks scanner on Japanese candlesticks.
ProTrendLines
S3
S2
S1
R1
R2
R3
Price
| S3 | S2 | S1 | Price | R1 | R2 | R3 | |
|---|---|---|---|---|---|---|---|
| ProTrendLines | 101.0 | 103.8 | 106.6 | 106.8 | 107.8 | 108.6 | 109.7 |
| Change (%) | -5.43% | -2.81% | -0.19% | - | +0.94% | +1.69% | +2.72% |
| Change | -5.8 | -3.0 | -0.2 | - | +1.0 | +1.8 | +2.9 |
| Level | Intermediate | Intermediate | Major | - | Minor | Minor | Major |
Attention could also be paid to pivot points to set price objectives:
Daily
| Pivot points | S3 | S2 | S1 | PP | R1 | R2 | R3 |
|---|---|---|---|---|---|---|---|
| Standard | 105.2 | 106.0 | 107.6 | 108.4 | 110.0 | 110.8 | 112.4 |
| Camarilla | 108.5 | 108.8 | 109.0 | 109.2 | 109.4 | 109.6 | 109.9 |
| Woodie | 105.6 | 106.2 | 108.0 | 108.6 | 110.4 | 111.0 | 112.8 |
| Fibonacci | 106.0 | 106.9 | 107.5 | 108.4 | 109.3 | 109.9 | 110.8 |
Weekly
| Pivot points | S3 | S2 | S1 | PP | R1 | R2 | R3 |
|---|---|---|---|---|---|---|---|
| Standard | 96.3 | 101.5 | 104.7 | 109.9 | 113.1 | 118.3 | 121.5 |
| Camarilla | 105.7 | 106.5 | 107.2 | 108.0 | 108.8 | 109.5 | 110.3 |
| Woodie | 95.4 | 101.0 | 103.8 | 109.4 | 112.2 | 117.8 | 120.6 |
| Fibonacci | 101.5 | 104.7 | 106.7 | 109.9 | 113.1 | 115.1 | 118.3 |
Monthly
| Pivot points | S3 | S2 | S1 | PP | R1 | R2 | R3 |
|---|---|---|---|---|---|---|---|
| Standard | 77.9 | 87.6 | 100.4 | 110.1 | 122.9 | 132.6 | 145.4 |
| Camarilla | 107.0 | 109.1 | 111.1 | 113.2 | 115.3 | 117.3 | 119.4 |
| Woodie | 79.5 | 88.4 | 102.0 | 110.9 | 124.5 | 133.4 | 147.0 |
| Fibonacci | 87.6 | 96.2 | 101.5 | 110.1 | 118.7 | 124.0 | 132.6 |
Numerical data
The following is the status of technical indicators and moving averages registered at the time this technical analysis was created:
Technical indicators
Moving averages
| RSI (14): | 43.40 | |
| MACD (12,26,9): | -0.3000 | |
| Directional Movement: | -11.8 | |
| AROON (14): | -7.1 | |
| DEMA (21): | 107.4 | |
| Parabolic SAR (0,02-0,02-0,2): | 109.1 | |
| Elder Ray (13): | -0.9 | |
| Super Trend (3,10): | 109.4 | |
| Zig ZAG (10): | 107.0 | |
| VORTEX (21): | 0.8000 | |
| Stochastique (14,3,5): | 38.90 | |
| TEMA (21): | 107.5 | |
| Williams %R (14): | -61.10 | |
| Chande Momentum Oscillator (20): | -1.6 | |
| Repulse (5,40,3): | 0.6000 | |
| ROCnROLL: | 2 | |
| TRIX (15,9): | 0.0000 | |
| Courbe Coppock: | 1.00 |
| MA7: | 108.5 | |
| MA20: | 111.3 | |
| MA50: | 112.8 | |
| MA100: | 111.6 | |
| MAexp7: | 107.4 | |
| MAexp20: | 107.8 | |
| MAexp50: | 108.7 | |
| MAexp100: | 109.8 | |
| Price / MA7: | -1.57% | |
| Price / MA20: | -4.04% | |
| Price / MA50: | -5.32% | |
| Price / MA100: | -4.30% | |
| Price / MAexp7: | -0.56% | |
| Price / MAexp20: | -0.93% | |
| Price / MAexp50: | -1.75% | |
| Price / MAexp100: | -2.73% |
Quotes :
-
15 min delayed data
-
Euronext Paris
News
Don't forget to follow the news on SECHE ENVIRONNEM.. At the time of publication of this analysis, the latest news was as follows:
- Séché Environnement: Joint General Meeting of April 28, 2023
- Séché Environnement: Information on the Governance Code
- Séché Environnement: Activity in Q1 2023
- Séché Environnement: Release of the Universal Registration Document Including the Annual Financial Report
- Séché Environnement: Consolidated Results at December 31, 2022