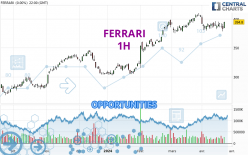
Londinia Opportunities Analyses - 04/24/2024 (GMT) FERRARI - 1H
-
EUR
(-)
-
15 min delayed data - Italy Stocks
| Type: | Stocks |
| Ticker: | RACE |
| ISIN: | NL0011585146 |
- Europe Stocks
- Timeframe : 1H
- - Analysis generated on
- Status : INVALID
Summary of the analysis
Trends
Short term:
Strongly bullish
Underlying:
Strongly bullish
Technical indicators
78%
6%
17%
My opinion
Bullish above 391.3 EUR
My targets
400.4 EUR (+1.60%)
403.7 EUR (+2.44%)
My analysis
FERRARI is part of a very strong bullish trend. Traders may consider trading only long positions (at the time of purchase) as long as the price remains well above 391.3 EUR. The next resistance located at 400.4 EUR is the next bullish objective to be reached. A bullish break in this resistance would boost the bullish momentum. The bullish movement could then continue towards the next resistance located at 403.7 EUR. After this resistance, buyers could then target 407.6 EUR. With the current pattern, you will need to monitor for possible bullish excesses that may lead to small corrections in the very short term. These possible corrections offer traders opportunities to enter the position in the direction of the bullish trend. Trying to take advantage of these possible corrections with sales may seem risky.
Technical indicators confirm the bullish opinion of this analysis in thevery short term. However, be careful of excessive bullish movements. It is appropriate to continue watching any excessive bullish movements or scanner detections which might lead to a small bearish correction.
Force
0
10
8.4

Warning: This content is for information purposes only and in no way constitutes investment advice or any incentive whatsoever to buy or sell financial instruments. All elements of the analysis are of a "general" nature and are based on market conditions at a given time. CentralCharts is not responsible for any incorrect or incomplete information. Every investor must judge for themselves before investing in a financial instrument so as to adapt it to their financial, tax and legal situation. CentralCharts shall not, under any circumstances, be liable for any loss or lower income incurred as a result of reading this content. Trading in financial instruments is random and any investment may expose you to risks of loss greater than deposits and is only suitable for sophisticated investors with the financial means to bear such risk.
Additional analysis
Quotes
The FERRARI price is 394.1 EUR. The price is lower by -0.18% since the last closing and was between 392.7 EUR and 397.0 EUR. This implies that the price is at +0.36% from its lowest and at -0.73% from its highest.392.7
397.0
394.1
A bullish gap was detected at the opening by the Central Gaps scanner. There are a lot of buyers and they have the upper hand in the very short term.
Opening Gap UP
Type : Bullish
Timeframe : Openning
Here is a more detailed summary of the historical variations registered by FERRARI:
Near a new HIGH record (5 years)
Type : Bullish
Timeframe : Weekly
Near a new HIGH record (1 year)
Type : Bullish
Timeframe : Weekly
Near a new HIGH record (1st january)
Type : Bullish
Timeframe : Weekly
Near a new LOW record (1 month)
Type : Bearish
Timeframe : Weekly
Technical
Technical analysis of FERRARI in 1H shows a strongly overall bullish trend. The signals given by the moving averages are 92.86% bullish. This strong bullish trend is confirmed by the strong signals currently being given by short-term moving averages. The Central Indicators scanner detects a bullish signal on moving averages that could impact this trend:
Moving Average bullish crossovers : MA20 & MA50
Type : Bullish
Timeframe : 1 hour
In fact, 14 technical indicators on 18 studied are currently bullish. Central Indicators, the scanner specialised in technical indicators, has identified this signal:
Pivot points : price is over resistance 1
Type : Neutral
Timeframe : Weekly
Central Patterns, the market scanner focusing on chart patterns, resistances and supports found this result:
Near horizontal support
Type : Bullish
Timeframe : 1 hour
The Central Candlesticks scanner, specialised in Japanese candlesticks, did not identify any signals.
ProTrendLines
S3
S2
S1
R1
R2
R3
Price
| S3 | S2 | S1 | Price | R1 | R2 | R3 | |
|---|---|---|---|---|---|---|---|
| ProTrendLines | 383.1 | 386.1 | 391.3 | 394.1 | 400.4 | 403.7 | 407.6 |
| Change (%) | -2.79% | -2.03% | -0.71% | - | +1.60% | +2.44% | +3.43% |
| Change | -11.0 | -8.0 | -2.8 | - | +6.3 | +9.6 | +13.5 |
| Level | Major | Minor | Intermediate | - | Minor | Major | Major |
Attention could also be paid to pivot points to set price objectives:
Daily
| Pivot points | S3 | S2 | S1 | PP | R1 | R2 | R3 |
|---|---|---|---|---|---|---|---|
| Standard | 376.0 | 379.8 | 387.3 | 391.1 | 398.6 | 402.4 | 409.9 |
| Camarilla | 391.7 | 392.7 | 393.8 | 394.8 | 395.8 | 396.9 | 397.9 |
| Woodie | 377.9 | 380.7 | 389.2 | 392.0 | 400.5 | 403.3 | 411.8 |
| Fibonacci | 379.8 | 384.1 | 386.8 | 391.1 | 395.4 | 398.1 | 402.4 |
Weekly
| Pivot points | S3 | S2 | S1 | PP | R1 | R2 | R3 |
|---|---|---|---|---|---|---|---|
| Standard | 364.4 | 372.1 | 378.4 | 386.1 | 392.4 | 400.1 | 406.4 |
| Camarilla | 381.0 | 382.2 | 383.5 | 384.8 | 386.1 | 387.4 | 388.7 |
| Woodie | 363.8 | 371.8 | 377.8 | 385.8 | 391.8 | 399.8 | 405.8 |
| Fibonacci | 372.1 | 377.4 | 380.7 | 386.1 | 391.4 | 394.7 | 400.1 |
Monthly
| Pivot points | S3 | S2 | S1 | PP | R1 | R2 | R3 |
|---|---|---|---|---|---|---|---|
| Standard | 346.0 | 359.6 | 380.5 | 394.1 | 415.0 | 428.6 | 449.5 |
| Camarilla | 392.0 | 395.2 | 398.3 | 401.5 | 404.7 | 407.8 | 411.0 |
| Woodie | 349.8 | 361.4 | 384.3 | 395.9 | 418.8 | 430.4 | 453.3 |
| Fibonacci | 359.6 | 372.8 | 380.9 | 394.1 | 407.3 | 415.4 | 428.6 |
Numerical data
The following is the status of technical indicators and moving averages registered at the time this technical analysis was created:
Technical indicators
Moving averages
| RSI (14): | 65.00 | |
| MACD (12,26,9): | 2.2000 | |
| Directional Movement: | 25.0 | |
| AROON (14): | 92.9 | |
| DEMA (21): | 392.0 | |
| Parabolic SAR (0,02-0,02-0,2): | 386.9 | |
| Elder Ray (13): | 3.2 | |
| Super Trend (3,10): | 386.6 | |
| Zig ZAG (10): | 393.3 | |
| VORTEX (21): | 1.1000 | |
| Stochastique (14,3,5): | 84.90 | |
| TEMA (21): | 394.0 | |
| Williams %R (14): | -24.50 | |
| Chande Momentum Oscillator (20): | 10.0 | |
| Repulse (5,40,3): | -0.5000 | |
| ROCnROLL: | 1 | |
| TRIX (15,9): | 0.0000 | |
| Courbe Coppock: | 5.40 |
| MA7: | 388.2 | |
| MA20: | 389.6 | |
| MA50: | 384.1 | |
| MA100: | 353.3 | |
| MAexp7: | 392.5 | |
| MAexp20: | 389.7 | |
| MAexp50: | 387.9 | |
| MAexp100: | 387.7 | |
| Price / MA7: | +1.52% | |
| Price / MA20: | +1.16% | |
| Price / MA50: | +2.60% | |
| Price / MA100: | +11.55% | |
| Price / MAexp7: | +0.41% | |
| Price / MAexp20: | +1.13% | |
| Price / MAexp50: | +1.60% | |
| Price / MAexp100: | +1.65% |
Quotes :
-
15 min delayed data
-
Actions Italie
News
Don't forget to follow the news on FERRARI. At the time of publication of this analysis, the latest news was as follows:
- FERRARI TO ANNOUNCE FIRST QUARTER 2024 FINANCIAL RESULTS ON MAY 7
- Ferrari N.V.: Periodic Report on the Buyback Program
- Ferrari Announces Voting Results From Its Annual General Meeting
- Ferrari N.V.: Periodic Report on the Buyback Program
- Ferrari N.V.: Periodic Report on the Buyback Program