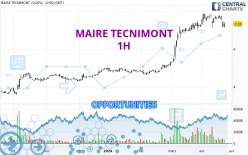
Londinia Opportunities Analyses - 04/24/2024 (GMT) MAIRE TECNIMONT - 1H
| Type: | Stocks |
| Ticker: | MAIRE |
| ISIN: | IT0004931058 |
- Europe Stocks
- Timeframe : 1H
- - Analysis generated on
- Status : INVALID
Summary of the analysis

Additional analysis
Quotes
The MAIRE TECNIMONT rating is 7.120 EUR. The price is lower by -2.87% since the last closing and was between 7.100 EUR and 7.385 EUR. This implies that the price is at +0.28% from its lowest and at -3.59% from its highest.A bullish opening was detected by the Central Gaps scanner. Buyers are trying to impose a bullish momentum in the very short term.
Bullish opening
Type : Bullish
Timeframe : Openning
So that you have an overall view of the price change, here is a table showing the variations over several periods:
Near a new HIGH record (5 years)
Type : Bullish
Timeframe : Weekly
Near a new HIGH record (1 year)
Type : Bullish
Timeframe : Weekly
Near a new HIGH record (1st january)
Type : Bullish
Timeframe : Weekly
Near a new HIGH record (1 month)
Type : Bullish
Timeframe : Weekly
Abnormal volumes on MAIRE TECNIMONT were detected by the Central Volumes scanner:
Abnormal volumes
Timeframe : 20 days
Abnormal volumes
Timeframe : 50 days
Technical
Technical analysis of MAIRE TECNIMONT in 1H shows a overall strongly bearish trend. 92.86% of the signals given by moving averages are bearish. The overall trend is supported by the strong bearish signals from short-term moving averages. The Central Indicators scanner detects a bearish signal on moving averages that could impact this trend:
Moving Average bearish crossovers : MA50 & MA100
Type : Bearish
Timeframe : 1 hour
In fact, according to the parameters integrated into the Central Analyzer system, 14 technical indicators out of 18 analysed are currently bearish. But beware of excesses. The Central Indicators scanner currently detects this:
CCI indicator is oversold : under -100
Type : Neutral
Timeframe : 1 hour
Williams %R indicator is oversold : under -80
Type : Neutral
Timeframe : 1 hour
Pivot points : price is under support 1
Type : Neutral
Timeframe : 1 hour
Pivot points : price is under support 3
Type : Neutral
Timeframe : Weekly
Central Patterns, the market scanner focusing on chart patterns, resistances and supports found these results:
Near horizontal support
Type : Bullish
Timeframe : 1 hour
Near support of channel
Type : Bullish
Timeframe : 1 hour
The Central Candlesticks scanner, specialised in Japanese candlesticks, did not identify any signals.
| S3 | S2 | S1 | Price | R1 | R2 | R3 | |
|---|---|---|---|---|---|---|---|
| ProTrendLines | 4.540 | 6.855 | 6.972 | 7.120 | 7.145 | 7.237 | 7.316 |
| Change (%) | -36.24% | -3.72% | -2.08% | - | +0.35% | +1.64% | +2.75% |
| Change | -2.580 | -0.265 | -0.148 | - | +0.025 | +0.117 | +0.196 |
| Level | Major | Major | Minor | - | Intermediate | Minor | Intermediate |
Pivot points can also be used to set your price objectives. Here is the price situation in relation to pivot points:
| Pivot points | S3 | S2 | S1 | PP | R1 | R2 | R3 |
|---|---|---|---|---|---|---|---|
| Standard | 6.878 | 7.017 | 7.173 | 7.312 | 7.468 | 7.607 | 7.763 |
| Camarilla | 7.249 | 7.276 | 7.303 | 7.330 | 7.357 | 7.384 | 7.411 |
| Woodie | 6.888 | 7.021 | 7.183 | 7.316 | 7.478 | 7.611 | 7.773 |
| Fibonacci | 7.017 | 7.129 | 7.199 | 7.312 | 7.424 | 7.494 | 7.607 |
| Pivot points | S3 | S2 | S1 | PP | R1 | R2 | R3 |
|---|---|---|---|---|---|---|---|
| Standard | 7.054 | 7.206 | 7.283 | 7.435 | 7.512 | 7.664 | 7.741 |
| Camarilla | 7.296 | 7.317 | 7.338 | 7.359 | 7.380 | 7.401 | 7.422 |
| Woodie | 7.016 | 7.187 | 7.245 | 7.416 | 7.474 | 7.645 | 7.703 |
| Fibonacci | 7.206 | 7.294 | 7.348 | 7.435 | 7.523 | 7.577 | 7.664 |
| Pivot points | S3 | S2 | S1 | PP | R1 | R2 | R3 |
|---|---|---|---|---|---|---|---|
| Standard | 3.505 | 4.314 | 5.696 | 6.505 | 7.887 | 8.696 | 10.078 |
| Camarilla | 6.475 | 6.675 | 6.876 | 7.077 | 7.278 | 7.479 | 7.680 |
| Woodie | 3.791 | 4.457 | 5.982 | 6.648 | 8.173 | 8.839 | 10.364 |
| Fibonacci | 4.314 | 5.151 | 5.668 | 6.505 | 7.342 | 7.859 | 8.696 |
Numerical data
The following is the status of the technical indicators and moving averages at the time of publication of this technical analysis:
| RSI (14): | 32.92 | |
| MACD (12,26,9): | -0.0460 | |
| Directional Movement: | -24.660 | |
| AROON (14): | -50.000 | |
| DEMA (21): | 7.267 | |
| Parabolic SAR (0,02-0,02-0,2): | 7.445 | |
| Elder Ray (13): | -0.130 | |
| Super Trend (3,10): | 7.427 | |
| Zig ZAG (10): | 7.115 | |
| VORTEX (21): | 0.8150 | |
| Stochastique (14,3,5): | 28.68 | |
| TEMA (21): | 7.241 | |
| Williams %R (14): | -95.71 | |
| Chande Momentum Oscillator (20): | -0.110 | |
| Repulse (5,40,3): | -3.5900 | |
| ROCnROLL: | 2 | |
| TRIX (15,9): | -0.0680 | |
| Courbe Coppock: | 0.77 |
| MA7: | 7.351 | |
| MA20: | 7.365 | |
| MA50: | 6.448 | |
| MA100: | 5.537 | |
| MAexp7: | 7.262 | |
| MAexp20: | 7.322 | |
| MAexp50: | 7.378 | |
| MAexp100: | 7.382 | |
| Price / MA7: | -3.14% | |
| Price / MA20: | -3.33% | |
| Price / MA50: | +10.42% | |
| Price / MA100: | +28.59% | |
| Price / MAexp7: | -1.96% | |
| Price / MAexp20: | -2.76% | |
| Price / MAexp50: | -3.50% | |
| Price / MAexp100: | -3.55% |
News
The latest news and videos published on MAIRE TECNIMONT at the time of the analysis were as follows:
- NEXTCHEM (MAIRE TECNIMONT GROUP) AWARDED PRE - FEED ENGINEERING SERVICES CONTRACT FOR THE INTEGRATED RENEWABLE HYDROGEN AND GREEN AMMONIA BY MADOQUAPOWER2X IN SINES, PORTUGAL
- NEXTCHEM AWARDED ADVANCED BASIC ENGINEERING STUDY BY STORENGY (ENGIE) FOR A NEW WAY OF PRODUCING BIOMETHANE FROM PYROGASIFICATION OF WASTE WOOD
- Maire Tecnimont Group (MT.MI) Reaches an Agreement With Greenfield Nitrogen LLC for the Development of a Green Ammonia Plant in the United States
- Maire Tecnimont Group (MT.MI) Reaches an Agreement With Greenfield Nitrogen LLC for the Development of a Green Ammonia Plant in the United States
- Maire Tecnimont Group (MT.MI) Reaches an Agreement With Greenfield Nitrogen LLC for the Development of a Green Ammonia Plant in the United States