Chart pattern: Diamond top
-
- 1
- Who voted?
- 6370
- 0
What is a diamond top?
A diamond top is a bearish, trend reversal, chart pattern.
A diamond top is formed by two juxtaposed symmetrical triangles, so forming a diamond.
A diamond top has to be preceded by a bullish trend. This pattern marks the exhaustion of the buying current and investor indecision.
Volatility and oscillations increase in the first half of the pattern (i.e. in the symmetric broadening wedge pattern); then decrease in the second half of the pattern (i.e. in the symmetric triangle).
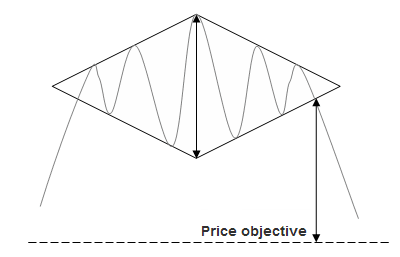
A diamond top’s price objective is calculated by plotting the minimum height of the diamond at the exit point.
In general, the exit movement is as fast as the upward movement that preceded it.
Graphical representation of a diamond top
Statistics of diamond tops
- In 80% of cases, the exit from a diamond top is bearish.
- In 95% of cases, the price objective of a diamond top is reached.
- After exit, in 59% of cases, the price makes a pullback in resistance on the support line of the symmetrical triangle (2nd half of the diamond).
Notes about diamond top
- Diamond tops appear 3 times more often than diamond bottoms.
- Sometimes the price line forms a head and shoulders within the diamond top.
- A diamond top pattern is very difficult to spot, and often forgotten by traders.
- The first half of a diamond top is a symmetrical broadening wedge pattern (continuation pattern) while the diamond top (the 2 halves together) is a reversal pattern.
For your information: A diamond top is a reversal chart pattern. Its opposite is a diamond bottom.


